Visualizing Code Metrics with Treemap
Introduction
The NDepend Metric View offers many capabilities to visualize an application code metrics. This way, code flaws and code patterns become more apparent. Such perspectives aim to enhance your understanding of the code base, to let you take better decision to increase code quality and code maintainability.
NDepend Code Metrics Walkthrough (3 minutes)
Visualization Tools
Size Metric and Treemaping
In the Metric View, the code base is represented through a Treemap. Treemapping is a visualization algorithm for displaying tree-structured data by using a nested rectangles hierarchy. The tree structure used in NDepend treemap is the usual code hierarchy:
- .NET assemblies contain namespaces
- namespaces contain types
- types contains methods and fields
Treemap rectangles represent code elements. The option level determines the kind of code element represented by unit rectangles. The option level can take the 5 values: assembly, namespace, type, method and field. The two screenshots below show the same code base displayed by Method level (on the left) and Namespace level (on the right).
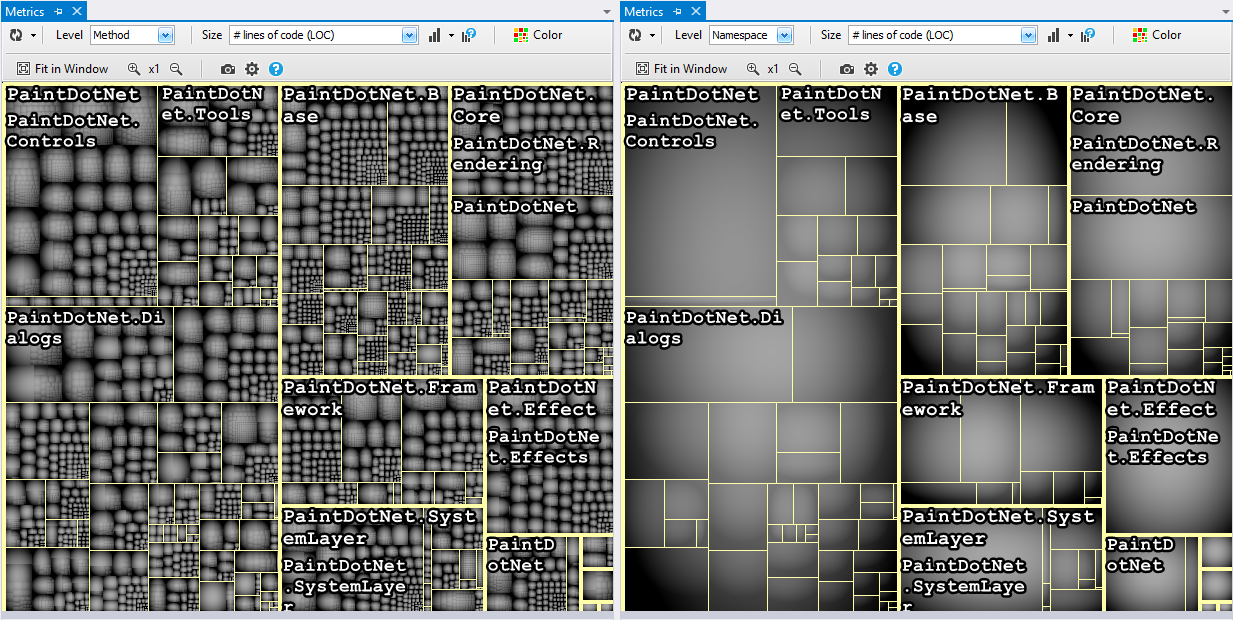
Notice how code elements that belong to the same parent code elements (like methods in a class, or classes in a namespaces) are located near on the treemap.
The option Size of the treemap determines the size of rectangles. For example if level is set to type and metric is set to number of Lines of Code, each unit rectangle represents a type, and the size of a unit rectangle is proportional to the number of Lines of Code of the corresponding type.
For each code element level, several code metrics are proposed. Also as explained later in this document, it is possible to define custom code metrics and visualize them through treemaping.

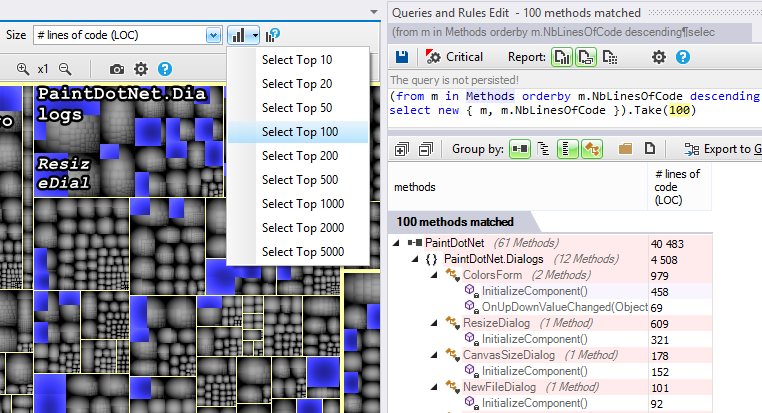
An option lets generate a CQLinq code query to Select the Top N code elements according to the selected Size code metrics.
Color Metric
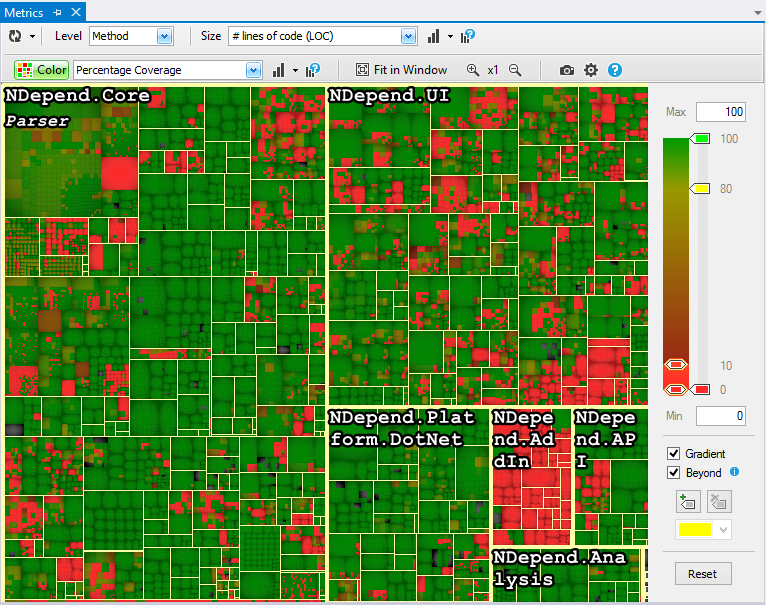
The section above explained how a code metric can be visualized thanks to treemaping. A second code metric can be represented by coloring code elements rectangle. Hence the NDepend metric view makes convenient to correlate 2 code metrics. For example the screenshot below shows code coverage by tests on the NDepend code base.
With NDepend or some other tools, it is possible to get the code coverage ratio for each method/type/namespace/assembly. But by combining #lines of code with code coverage ratio colored treemaping, we get a unique insightful view of what is covered or not by tests. For example, despite the fact that the NDepend code base is more than 80% covered by tests, which is a good score, the colored treemap shows red regions like NDepend.Addin.dll that certainly deserve more automatic testing.
The color metric visualization can be customized through cursors on the right pane. Cursors can be adjusted/added/removed. Each cursor color can be changed, upper and lower bounds can be redefined. Your custom cursor color settings is automatically persisted for each Color Metric and there is a Reset button to get back to default cursor color settings.
The color scale ribbon contains two cursors dedicated to define a sub-interval. Defining an interval is useful to focus on a range of values, like poorly covered methods below.
Focusing on a Particular Code Element
Several ways are proposed to identify code elements shown in the Metric View. When you hover the treemap with the mouse, the pointed code element rectangle gets highlighted, and its name and containing parents' names, are shown. The code element Size and Color metrics values are also shown. Right-clicking such code elements lets access to all NDepend actions, like opening the source code declaration of the hovered code element.
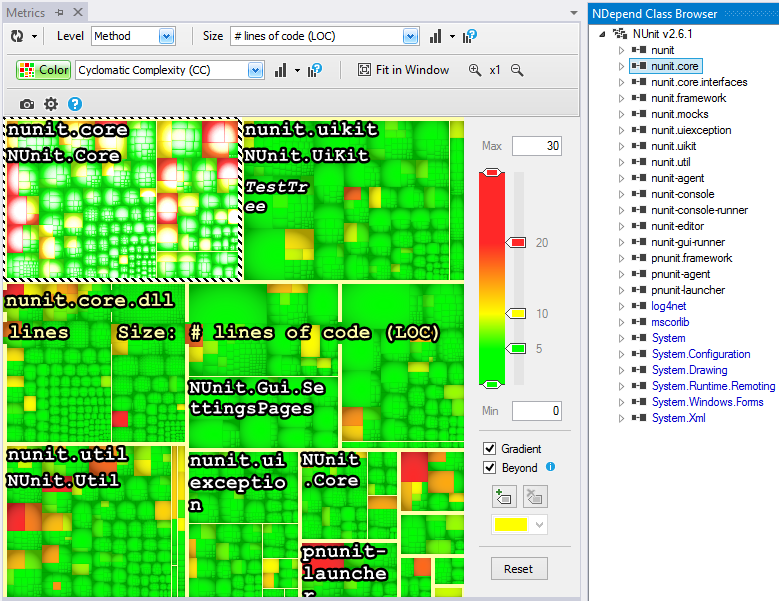
When hovering a code element in any NDepend windows, like the Class Browser or the Code Query Result windows, it gets highlighted in the Metric View:
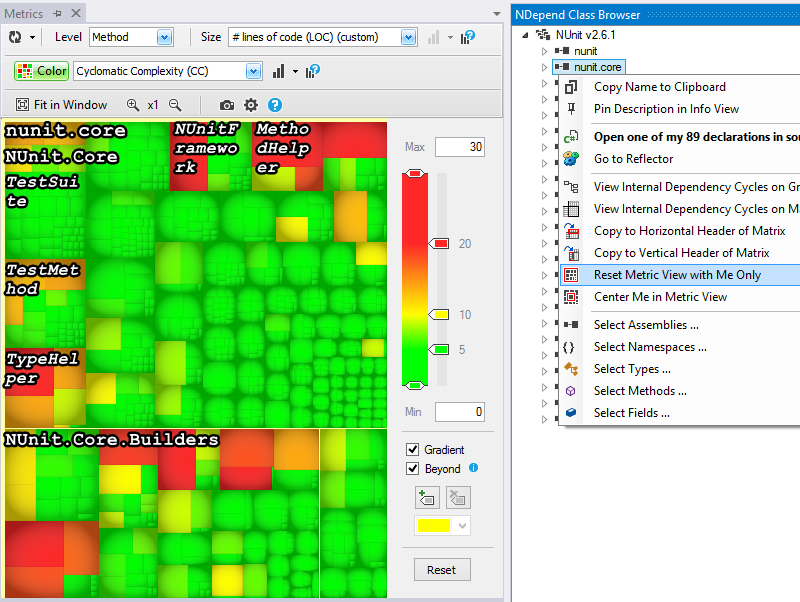
Also, right clicking a code element proposes the menu to Reset the Metric View with this Code Element Only. In case of large code base, this is especially useful to focus on a particular assembly or namespace.
Visualizing Code Query Result
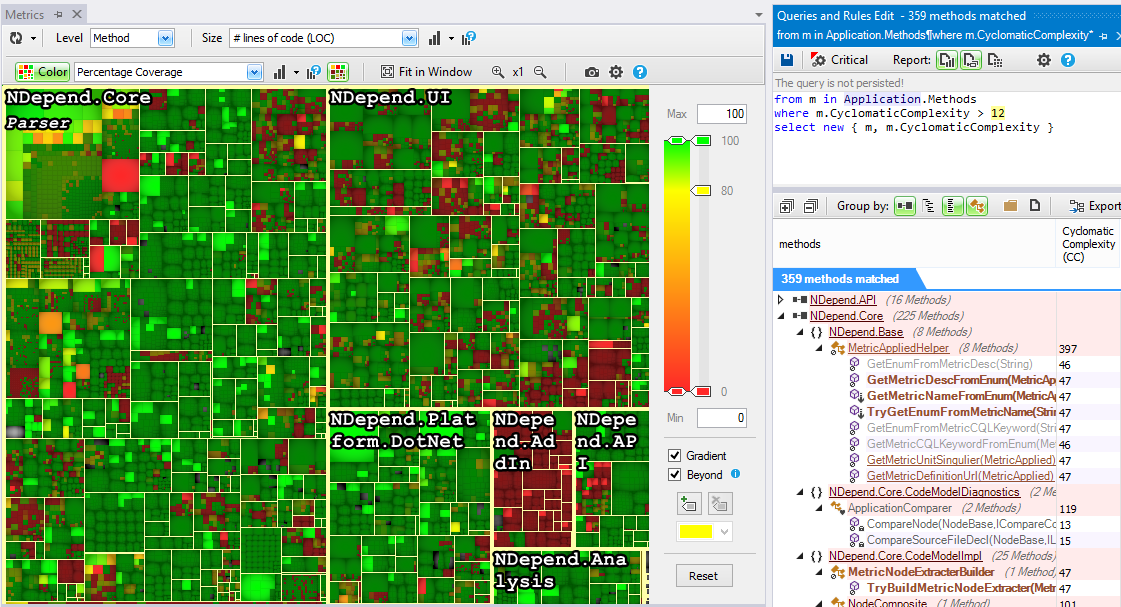
When a CQLinq query is currently edited, the set of code elements matched by the query is shown on the treemap as a set of highlighted rectangles. In the screenshot below, a CQLinq query matches methods with a Cyclomatic Complexity value higher than 12. The highlighted set of complex methods provides a better understanding of their density and their repartition.
Visualizing Custom Metrics
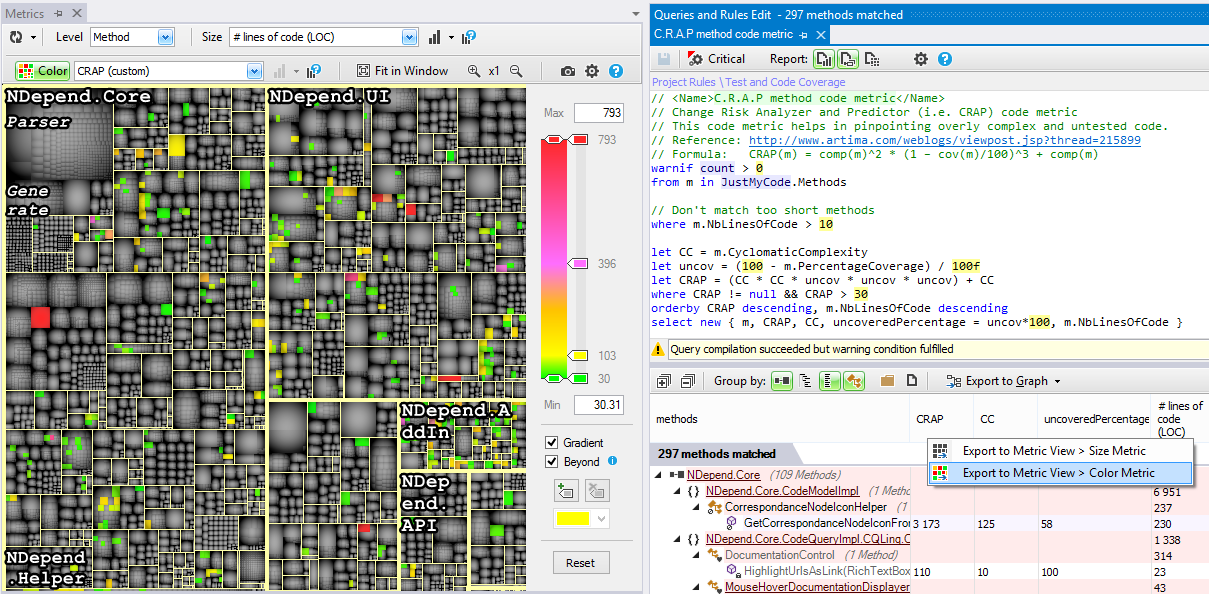
With the CQLinq language, it is possible to define custom code metrics. For example, in the group Test and Code Coverage of default Code Rules, the Change Risk Analyzer and Predictor (i.e. CRAP) custom code metric is defined. This code metric helps in pinpointing overly complex and untested code. To reset the Size or Color of the Metric View with such custom code metric, the header of the column in the query result can be right clicked, to get exports to Size and Color metrics menus.
Removing not-my-code Elements from the Metric View
The export to metric view feature just shown above is flexible and can be used in many scenarios.
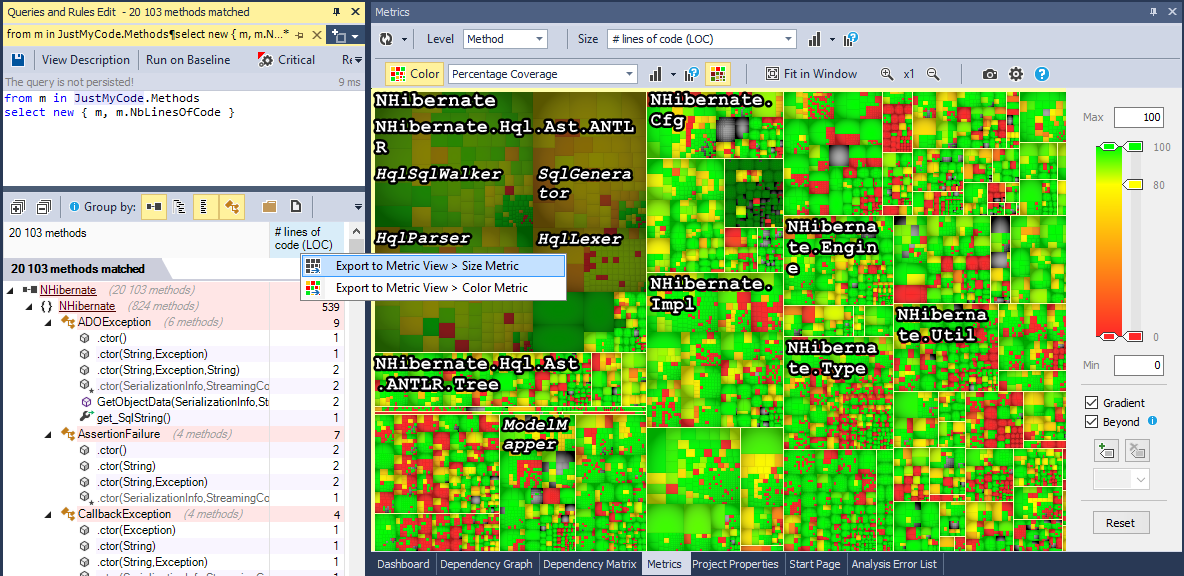
Typically the user might want to remove not-my-code elements from the metric view. To do so, just edit the code query below and export its result to the Metric View > Size Metric.
from m in JustMyCode.Methods
select new { m, m.NbLinesOfCode }
Common Scenarios
By choosing an appropriate combination of Size and Color code metrics, the Metric View can help to visualize patterns and facts about a code base, that would be hard to spot by other means.
Too Big, Too Complex
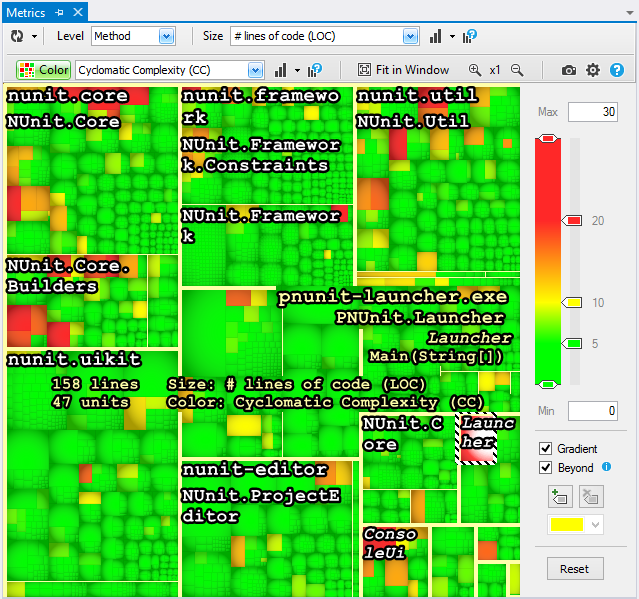
NDepend provides many code metrics to spot too big and too complex code elements. Method with too many parameters, too many variables, too many lines of code, too high cyclomatic complexity etc... should be banished. The same way types with too many lines of code should be banished too. Having such a coarse-grained design makes difficult to maintain the code base.
On the screenshot below, the level is set to methods, the size metric is number of lines of code and the color metric is Cyclomatic Complexity. Large rectangles represent large methods of the code base. Orange and red rectangles represent complex methods. Not only with such Metric View spotting too large and too complex methods is easy, but also, it helps comparing their respective size and complexity.
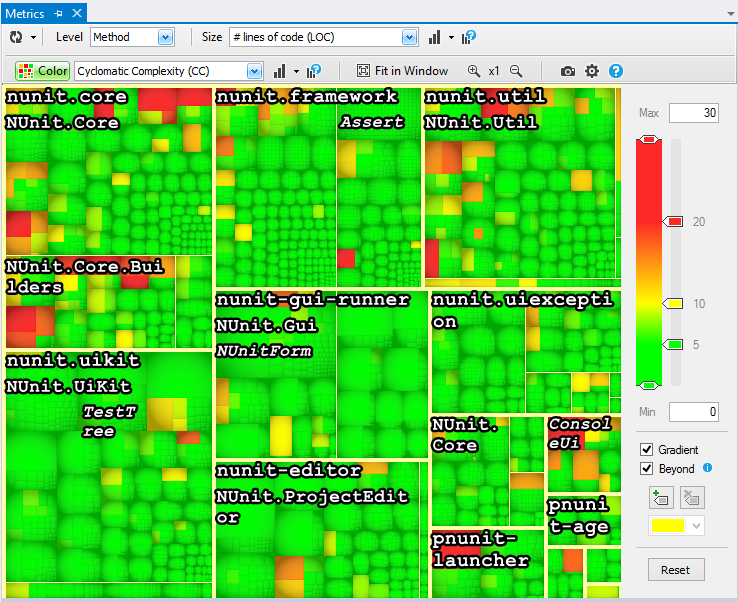
Notice the menu that presents the most common Size/Color metrics pairs.

Code Coverage Visualization
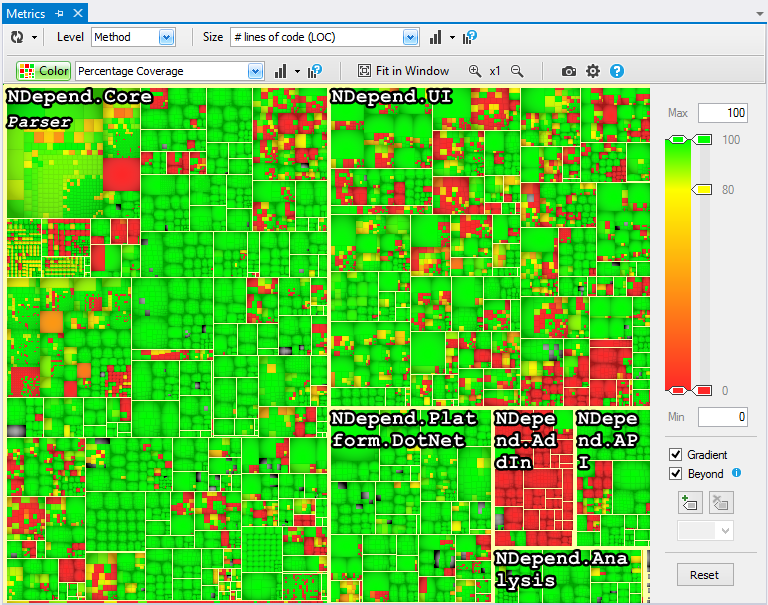
One of the top usage of the Metric View consists in visualizing Code Coverage by tests of a codebase. The Size metric must be set to number of lines of code and the Color metric set to Percentage Coverage. We then get a unique insightful view of what is covered or not by tests.
The screenshot below shows how NDepend is covered by tests. Despite the fact that the NDepend code base is more than 80% covered by tests, which is a good score, the colored treemap shows red regions like NDepend.Addin.dll that certainly deserve more automatic testing.
Isolated red rectangles also indicates types that have just one or a few uncovered methods. Typically it is worth investigating why a class is only partially covered. Experience shows that dead/unused code or buggy code is often found in methods uncovered by automatic tests.

Code Structure Visualization
Using the Metric View with a metric different than volume (lines of code, number of parameters for methods...) or complexity, can reveal interesting observations on code structure.
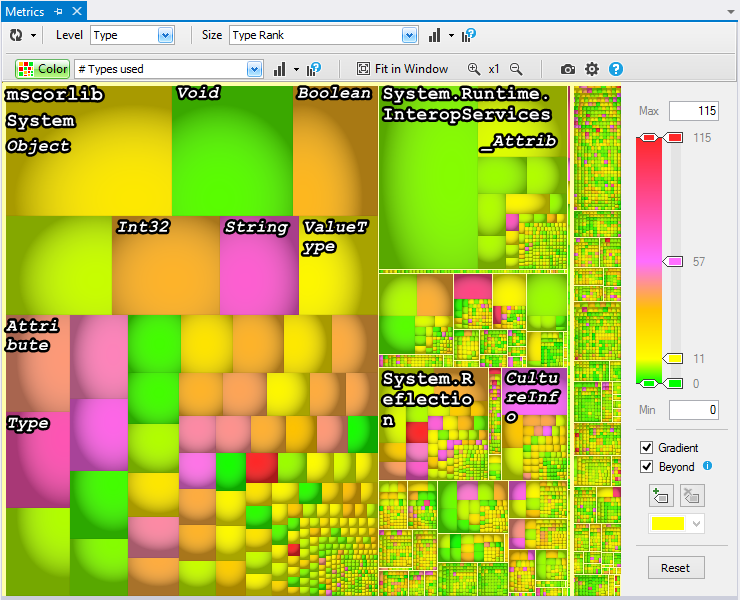
The ranking metric is a code metric that measures the popularity of a type or a method in a code base. Using treemapping with the ranking metric gives a clear view of where popular types are declared. Doing so, intuitively offers information about what is important in the code base.
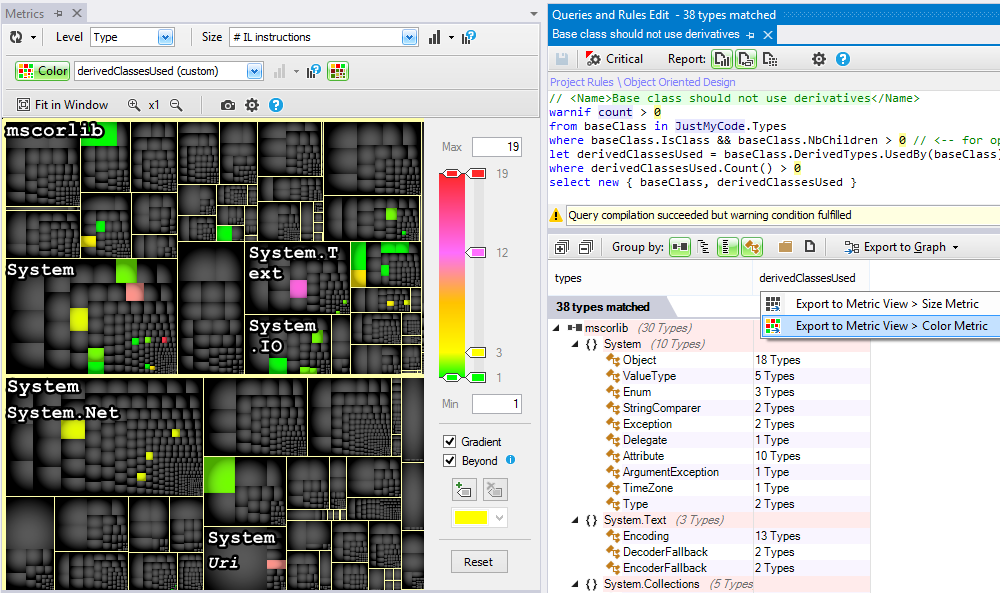
The screenshot below shows types of mscorlib.dll code base treemaped with the ranking metric. As expected, types like Object, Int32 and String are among the most popular ones. The Color metric is set to Number of Types Used. The number of types used offers a glimpse at the number of responsibilities for a type. Hence, while the Void popular type is green (it just uses 4 types), the String class is violet (it is using 69 types).
The same kind of interesting Code Structure Observations can be made with code metrics such as Number of Types Used me or Level.
Pinpoint Where Are Flaws
The Metric View highlights code elements matched by the Code Query currently edited. Since a Code Rule is a Code Query where code elements matched have a flaw, this facilities can be used to pinpoint where are flaws located in the code base.
In the screenshot below we are querying with a CQLinq rule, which base class is using its derivatives. Then we export the Number of Derivatives Used metric to the Metric View. Not only we can locate such base class, but the color of highlighted rectangles offers an indication of how many derivatives are used. We can see that this anti-pattern is more prevalent in mscorlib than in System.