
100+ .NET and C# Code Metrics
Introduction
To learn metrics, you can print this Placemat Visualization Expert by Stuart Celarier MVP (Corillian) or you can print this Metrics Cheat Sheet by Frank-Leonardo Quednau'
-
14 metrics on Application
NbLinesOfCode, NbLinesOfComment, PercentageComment, NbILInstructions, NbAssemblies, NbNamespaces, NbTypes, NbMethods, NbFields, NbProperties, NbEvents, PercentageCoverage, NbLinesOfCodeCovered, NbLinesOfCodeNotCovered
-
20 metrics on Assemblies:
NbLinesOfCode, NbLinesOfComment, PercentageComment, NbILInstructions, NbNamespaces, NbTypes, NbMethods, NbFields, NbProperties, NbEvents, Assembly level, Afferent coupling (Ca), Efferent coupling (Ce), Relational Cohesion(H), Instability (I), Abstractness (A), Distance from main sequence (D), PercentageCoverage, NbLinesOfCodeCovered, NbLinesOfCodeNotCovered
-
15 metrics on Namespaces:
NbLinesOfCode, NbLinesOfComment, PercentageComment, NbILInstructions, NbTypes, NbMethods, NbFields, NbProperties, NbEvents, Namespace level, Afferent coupling at namespace level (NamespaceCa), Efferent coupling at namespace level (NamespaceCe), PercentageCoverage, NbLinesOfCodeCovered, NbLinesOfCodeNotCovered
-
24 metrics on Types:
NbLinesOfCode, NbLinesOfComment, PercentageComment, NbILInstructions, NbMethods, NbFields, NbProperties, NbEvents, NbInterfacesImplemented, Type level, Type rank, Afferent coupling at type level (TypeCa), Efferent coupling at type level (TypeCe), Lack of Cohesion Of Methods (LCOM), Lack of Cohesion Of Methods Henderson-Sellers (LCOM HS), Code Source Cyclomatic Complexity, IL Cyclomatic Complexity (ILCC), Size of instance, Association Between Class (ABC) Number of Children (NOC), Depth of Inheritance Tree (DIT), PercentageCoverage, NbLinesOfCodeCovered, NbLinesOfCodeNotCovered
-
19 metrics on Methods:
NbLinesOfCode, NbLinesOfComment, PercentageComment, NbILInstructions, Method level, Method rank, Afferent coupling at method level (MethodCa), Efferent coupling at method level (MethodCe), Code Source Cyclomatic Complexity, IL Cyclomatic Complexity (ILCC), IL Nesting Depth, NbParameters, NbVariables, NbOverloads, PercentageCoverage, NbLinesOfCodeCovered, NbLinesOfCodeNotCovered, PercentageBranchCoverage
-
2 metrics on Fields:
Size of instance, Afferent coupling at field level (FieldCa)
-
9 metrics on Source Files:
NbLineFeed, NbLinesOfCode, NbCharacters, NbLinesOfComment, NbILInstructions, PercentageCoverage, NbLinesOfCodeCovered, NbLinesOfCodeNotCovered
NDepend Code Metrics Walkthrough (3 minutes)
Technical Debt Metrics
Since version 2017.1.0 NDepend offers smart technical-debt estimation of a code base.
Basically each NDepend code rule produces issues, and for each issue, some C# customizable formulas estimate the cost to fix these issues in terms of person-time.
This cost-to-fix can be seen as a debt the team owns: as long as the issue is not fixed, the debt is not reimbursed, and it has interests in terms of development friction. The code base technical-debt is the sum of all these debt estimations.
The technical debt can be seen as the mother of all code metrics.
- Every other code metrics, lines of code, complexity, code coverage, coupling ... can be harnessed through code rules with thresholds. The rules creates issues upon code metrics thresholds violations.
- And for each issue, we can estimate the cost to fix in terms of person-time.
- For each issue, we can also estimate the severity in terms of person-time per year consumed because of the issue left unfixed consequences.
Below you'll find the technical details for each code metric supported by NDepend. The technical debt estimation has its own documentation page that can be found here.
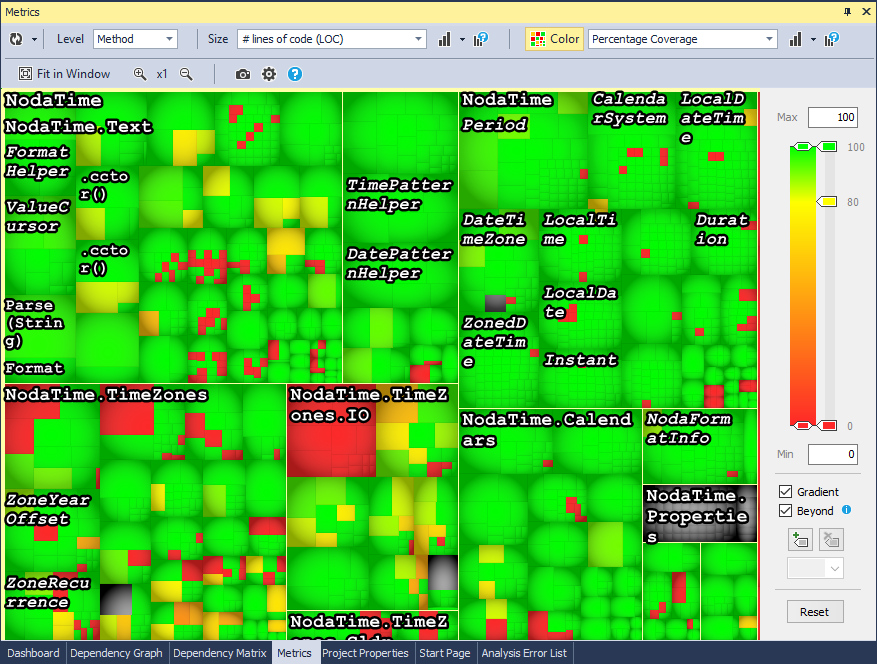
Code Metrics Visualization
NDepend offers code metric visualization through a colored treemap. Such visualization is especially useful to browse code coverage by tests of methods or classes of your code base. More on this feature in this documentation..
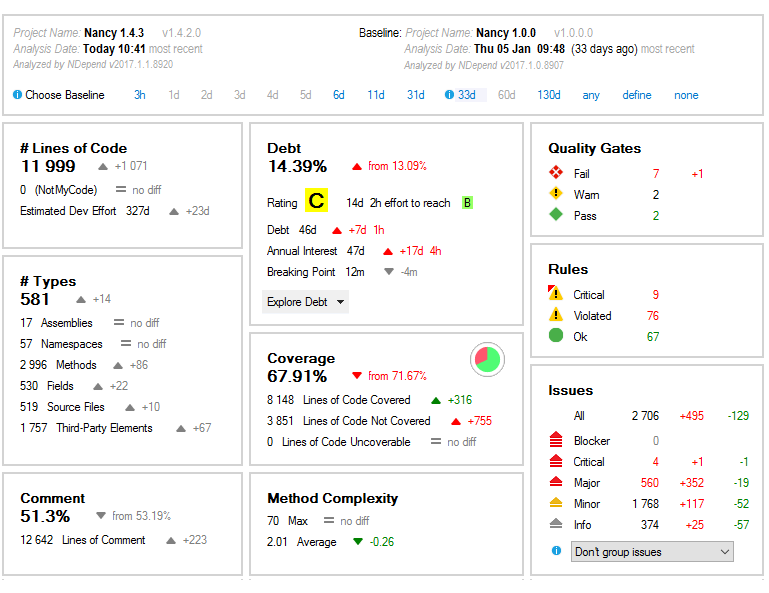
With the NDepend dashboard the user visualizes all application metrics at a glance. The dashboard is available in the Visual Studio extension, in the Azure DevOps extension and in the report.
For each metric, the dashboard shows the diff since baseline. It also shows if the metric value gets better (in green) or wort (in red).
Each value can be clicked to drill down. For example clicking the number of types will list all the types of the code base.
Metrics on Application
-
NbLinesOfCode: (defined for application, assemblies, namespaces, types, methods, source files) This metric (known as LOC) can be computed only if PDB files are present. NDepend computes this metric directly from the info provided in PDB files. The LOC for a method is equals to the number of sequence point found for this method in the PDB file. A sequence point is sometime named also a statement. A sequence point is used to mark a spot in the IL code that corresponds to a specific location in the original source. More info about sequence points here. Notice that sequence points which correspond to C# braces open and close ‘{‘ and ‘}’ are not taken account.
Computing the number of lines of code from PDB’s sequence points allows to obtain a logical LOC of code instead of a physical LOC (i.e directly computed from source files, see the metric NbLineFeed). 2 significant advantages of logical LOC over physical LOC are:
- Coding style doesn't interfere with logical LOC. For example the LOC won’t change because a method call is spawn on several lines because of a high number of parameters passed.
- logical LOC is independent from the language. Values obtained from assemblies written with different languages are comparable and can be summed.
Notice that the LOC for a type is the sum of its methods’ LOC, the LOC for a namespace is the sum of its types’ LOC, the LOC for an assembly is the sum of its namespaces’ LOC and the LOC for an application is the sum of its assemblies LOC. Here are some observations:
- Interfaces, abstract methods and enumerations have a LOC equals to 0. Only concrete code that is effectively executed is considered when computing LOC.
- Namespaces, types, fields and methods declarations are not considered as line of code because they don’t have corresponding sequence points.
- When the C# or VB.NET compiler faces an inline instance fields initialization, it generates a sequence point for each of the instance constructor (the same remark applies for inline static fields initialization and static constructor).
- LOC computed from an anonymous method doesn’t interfere with the LOC of its outer declaring methods.
- The overall ratio between NbILInstructions and LOC (in C# and VB.NET) is usually around 7.
Recommendations: Methods where NbLinesOfCode is higher than 20 are hard to understand and maintain. Methods where NbLinesOfCode is higher than 40 are extremely complex and should be split in smaller methods (except if they are automatically generated by a tool).
Related Links::
Mythical man month : 10 lines per developer day -
NbLinesOfComment: (defined for application, assemblies, namespaces, types, methods, source files) (Only available for C# code, a VB.NET version is currently under development) This metric can be computed only if PDB files are present and if corresponding source files can be found. The number of lines of comment is computed as follow:
- For a method, it is the number of lines of comment that can be found in its body. In C# the body of a method begins with a '{' and ends with a '}'. If a method contains an anonymous method, lines of comment defined in the anonymous method are not counted for the outer method but are counted for the anonymous method.
- For a type, it is the sum of the number of lines of comment that can be found in each of its partial definition. In C#, each partial definition of a type begins with a '{ and ends with a '}'.
- For a namespace, it is the sum of the number of lines of comment that can be found in each of its partial definition. In C# each partial definition of a namespace begins with a '{ and ends with a '}'.
- For an assembly, it is the sum of the number of lines of comment that can be found in each of its source file.
Notice that this metric is not an additive metric (i.e for example, the number of lines of comment of a namespace can be greater than the number of lines of comment over all its types).
Recommendations: This metric is not helpful to assess the quality of source code. We prefer to use the metric PercentageComment.
-
PercentageComment: (defined for application, assemblies, namespaces, types, methods) (Only available for C# code, a VB.NET version is currently under development) This metric is computed with the following formula:
PercentageComment = 100*NbLinesOfComment / ( NbLinesOfComment + NbLinesOfCode)
Recommendations: Code where the percentage of comment is lower than 20% should be more commented. However overly commented code (>40%) is not necessarily a blessing as it can be considered as an insult to the intelligence of the reader. Guidelines about code commenting can be found here.
-
NbILInstructions: (defined for application, assemblies, namespaces, types, methods, source files) Notice that the number of IL instructions can vary depending if your assemblies are compiled in debug or in release mode. Indeed compiler's optimizations can modify the number of IL instructions. For example a compiler can add some nop IL instructions in debug mode to handle Edit and Continue and to allow attach an IL instruction to a curly brace. Notice that IL instructions of third-party assemblies are not taken account.
Recommendations: Methods where NbILInstructions is higher than 100 are hard to understand and maintain. Methods where NbILInstructions is higher than 200 are extremely complex and should be split in smaller methods (except if they are automatically generated by a tool).
-
NbAssemblies: (defined for application) Only application assemblies are taken into account.
-
NbNamespaces: (defined for application, assemblies) The number of namespaces. The anonymous namespace counts as one. If a namespace is defined over N assemblies, it will count as N. Namespaces declared in third-party assemblies are not taken account.
-
NbTypes: (defined for application, assemblies, namespaces) The number of types. A type can be an abstract or a concrete class, a structure, an enumeration, a delegate class or an interface. Types declared in third-party assemblies are not taken account.
-
NbMethods: (defined for application, assemblies, namespaces, types) The number of methods. A method can be an abstract, virtual or non-virtual method, a method declared in an interface, a constructor, a class constructor, a finalizer, a property/indexer getter or setter, an event adder or remover. Methods declared in third-party assemblies are not taken account.
Recommendations: Types where NbMethods > 20 might be hard to understand and maintain but there might be cases where it is relevant to have a high value for NbMethods. For example, the System.Windows.Forms.DataGridView third-party class has more than 1000 methods.
-
NbFields: (defined for application, assemblies, namespaces, types) The number of fields. A field can be a regular field, an enumeration's value or a readonly or a const field. Fields declared in third-party assemblies are not taken account.
Recommendations: Types that are not enumeration and where NbFields is higher 20 might be hard to understand and maintain but there might be cases where it is relevant to have a high value for NbFields. For example, the System.Windows.Forms.Control third-party class has more than 200 fields.
-
NbProperties: (defined for application, assemblies, namespaces, types) The number of properties. Properties declared in third-party assemblies are not taken account.
-
NbEvents: (defined for application, assemblies, namespaces, types) The number of events. Events declared in third-party assemblies are not taken account.
-
PercentageCoverage: (defined for application, assemblies, namespaces, types, methods, source files) The percentage of statements covered by tests. Code coverage data are imported from coverage files (all .NET coverage technologies supported). If you are using the uncoverable attribute feature on a method for example, if all sibling methods are 100% covered, then the parent type will be considered as 100% covered.
Coverage metrics are not available if the metric NbLinesOfCode is not available.
Recommendations: The closer to 100%, the better.
-
NbLinesOfCodeCovered: (defined for application, assemblies, namespaces, types, methods, source files) The number of statements covered by tests.
-
NbLinesOfCodeNotCovered: (defined for application, assemblies, namespaces, types, methods, source files) The number of statements not covered by tests.
Metrics on Assemblies
By measuring coupling between types of your application, NDepend assesses the stability of each assembly. An assembly is considered stable if its types are used by a lot of types of third-party assemblies (i.e stable = painful to modify). If an assembly contains many abstract types (i.e interfaces and abstract classes) and few concrete types, it is considered as abstract. Thus, NDepend helps you detect which assemblies are potentially painful to maintain (i.e concrete and stable) and which assemblies are potentially useless (i.e abstract and instable).
Note: This theory and metrics have been first introduced by the excellent book Agile Software Development: Principles, Patterns, and Practices in C# Robert C. Martin (Prentice Hall PTR, 2006)
-
Afferent coupling (Ca): The number of types outside this assembly that depend on types within this assembly. High afferent coupling indicates that the concerned assemblies have many responsibilities.
Related Link::
Code metrics on Coupling, Dead Code, Design flaws and Re-engineering -
Efferent coupling (Ce): The number of types outside this assembly used by child types of this assembly. High efferent coupling indicates that the concerned assembly is dependant. Notice that types declared in third-party assemblies are taken into account.
Related Link::
Code metrics on Coupling, Dead Code, Design flaws and Re-engineering -
Relational Cohesion (H): Average number of internal relationships per type. Let R be the number of type relationships that are internal to this assembly (i.e that do not connect to types outside the assembly). Let N be the number of types within the assembly. H = (R + 1)/ N. The extra 1 in the formula prevents H=0 when N=1. The relational cohesion represents the relationship that this assembly has to all its types.
Recommendations: As classes inside an assembly should be strongly related, the cohesion should be high. On the other hand, too high values may indicate over-coupling. A good range for RelationalCohesion is 1.5 to 4.0. Assemblies where RelationalCohesion < 1.5 or RelationalCohesion > 4.0 might be problematic.
-
Instability (I): The ratio of efferent coupling (Ce) to total coupling. I = Ce / (Ce + Ca). This metric is an indicator of the assembly's resilience to change. The range for this metric is 0 to 1, with I=0 indicating a completely stable assembly and I=1 indicating a completely instable assembly.
-
Abstractness (A): The ratio of the number of internal abstract types (i.e abstract classes and interfaces) to the number of internal types. The range for this metric is 0 to 1, with A=0 indicating a completely concrete assembly and A=1 indicating a completely abstract assembly.
-
Distance from main sequence (D): The perpendicular normalized distance of an assembly from the idealized line A + I = 1 (called main sequence). This metric is an indicator of the assembly's balance between abstractness and stability. An assembly squarely on the main sequence is optimally balanced with respect to its abstractness and stability. Ideal assemblies are either completely abstract and stable (I=0, A=1) or completely concrete and instable (I=1, A=0). The range for this metric is 0 to 1, with D=0 indicating an assembly that is coincident with the main sequence and D=1 indicating an assembly that is as far from the main sequence as possible. The picture in the report reveals if an assembly is in the zone of pain (I and A both close to 0) or in the zone of uselessness (I and A both close to 1).
Recommendations: Assemblies where NormDistFromMainSeq is higher than 0.7 might be problematic. However, in the real world it is very hard to avoid such assemblies.
Metrics on Namespaces
-
Afferent coupling at namespace level (NamespaceCa): The Afferent Coupling for a particular namespace is the number of namespaces that depends directly on it.
Related Link::
Code metrics on Coupling, Dead Code, Design flaws and Re-engineering -
Efferent coupling at namespace level (NamespaceCe): The Efferent Coupling for a particular namespace is the number of namespaces it directly depends on. Notice that namespaces declared in third-party assemblies are taken into account.
Related Link::
Code metrics on Coupling, Dead Code, Design flaws and Re-engineering -
Level: (defined for assemblies, namespaces, types, methods) The Level value for a namespace is defined as follow:
- Level = 0 : if the namespace doesn't use any other namespace.
- Level = 1 : if the namespace only uses directly namespace defined in third-party assemblies.
- Level = 1 + (Max Level over namespace it uses direcly)
- Level = N/A : if the namespace is involved in a dependency cycle or uses directly or indirectly a namespace involved in a dependency cycle.
Level metric definitions for assemblies, types and methods are inferred from the above definition.
This metric has been first defined by John Lakos in his book Large-Scale C++ Software Design.
Recommendations: This metric helps objectively classify the assemblies, namespaces, types and methods as high level,mid level or low level. There is no particular recommendation for high or small values.
This metric is also useful to discover dependency cycles in your application. For instance if some namespaces are matched by the following CQLinq query, it means that there is some dependency cycles between the namespaces of your application:
from n in Application.Namespaces where n.Level == null select n
Related Link::
Layering, the Level metric and the Discourse of Method
Metrics on Types
-
Type rank: TypeRank values are computed by applying the Google PageRank algorithm on the graph of types' dependencies. A homothety of center 0.15 is applied to make it so that the average of TypeRank is 1.
Recommendations: Types with high TypeRank should be more carefully tested because bugs in such types will likely be more catastrophic.
Related Link::
Code metrics on Coupling, Dead Code, Design flaws and Re-engineering -
Afferent Coupling at type level (Ca): The Afferent Coupling for a particular type is the number of types that depends directly on it.
Related Link::
Code metrics on Coupling, Dead Code, Design flaws and Re-engineering -
Efferent Coupling at type level (Ce): The Efferent Coupling for a particular type is the number of types it directly depends on. Notice that types declared in third-party assemblies are taken into account.
Recommendations: Types where TypeCe > 50 are types that depends on too many other types. They are complex and have more than one responsibility. They are good candidate for refactoring.
Related Link::
Code metrics on Coupling, Dead Code, Design flaws and Re-engineering -
Lack of Cohesion Of Methods (LCOM): The single responsibility principle states that a class should not have more than one reason to change. Such a class is said to be cohesive. A high LCOM value generally pinpoints a poorly cohesive class. There are several LCOM metrics. The LCOM takes its values in the range [0-1]. The LCOM HS (HS stands for Henderson-Sellers) takes its values in the range [0-2]. A LCOM HS value higher than 1 should be considered alarming. Here are algorithms used by NDepend to compute LCOM metrics:
- LCOM = 1 – (sum(MF)/M*F)
- LCOM HS = (M – sum(MF)/F) / (M-1)
Where:
- M is the number of methods in class (both static and instance methods are counted, it also includes constructors but not properties get/set and events add/remove methods).
- F is the number of instance fields in the class (properties and events backing fields are not counted, also in the two definitions below).
- MF is the number of methods of the class accessing a particular instance field.
- Sum(MF) is the sum of MF over all instance fields of the class.
The underlying idea behind these formulas can be stated as follow: a class is utterly cohesive if all its methods use all its instance fields, which means that sum(MF)=M*F and then LCOM = 0 and LCOMHS = 0.
Recommendations: Types where LCOM > 0.8 and NbFields > 10 and NbMethods >10 might be problematic. However, it is very hard to avoid such non-cohesive types. Types where LCOMHS > 1.0 and NbFields > 10 and NbMethods >10 should be avoided. Note that this constraint is stronger (and thus easier to satisfy) than the constraint types where LCOM > 0.8 and NbFields > 10 and NbMethods >10.
-
Cyclomatic Complexity (CC): (defined for types, methods) (Only available for C# code, a VB.NET version is currently under development) Cyclomatic complexity is a popular procedural software metric equal to the number of decisions that can be taken in a procedure. Concretely, in C# the CC of a method is 1 + {the number of following expressions found in the body of the method}:
if  while  for  foreach  case  default  continue  goto  &&  ||  catch
ternary operator ?:  ??
C#9 and or (explained in this blog post)
Following expressions are not counted for CC computation:
else  do  switch  try  using  throw  finally  return  object creation
method call  field access
The Cyclomatic Complexity metric is defined on methods. Adapted to the OO world, this metric is also defined for classes and structures as the sum of its methods CC. Notice that the CC of an anonymous method is not counted when computing the CC of its outer method.
Recommendations:
Methods where CC is higher than 15 are hard to understand and maintain.
Methods where CC is higher than 30 are extremely complex and should be split into smaller methods (except if they are automatically generated by a tool).
-
IL Cyclomatic Complexity (ILCC):
The CC metric is language dependent. Thus, NDepend provides the ILCC which is language independent because it is computed from IL as 1 + {the number of different offsets targeted by a jump/branch IL instruction}.
Experience shows that NDepend CC is a bit larger than the CC computed in C# or VB.NET. Indeed, a C# 'if' expression yields one IL jump. A C# 'for' loop yields two different offsets targeted by a branch IL instruction while a foreach C# loop yields three.
Recommendations: Methods where ILCyclomaticComplexity is higher than 20 are hard to understand and maintain. Methods where ILCyclomaticComplexity is higher than 40 are extremely complex and should be split into smaller methods (except if they are automatically generated by a tool).
-
Size of instance : (defined for instance fields and types) The size of instances of an instance field is defined as the size, in bytes, of instances of its type. The size of instance of a static field is equal to 0. The size of instances of a class or a structure is defined as the sum of size of instances of its fields plus the size of instances of its base class. Fields of reference types (class, interface, delegate…) always count for 4 bytes while the footprint of fields of value types (structure, int, byte, double…) might vary. Size of instances of an enumeration is equal to the size of instances of the underlying numeric primitive type. It is computed from the value__ instance field (all enumerations have such a field when compiled in IL). Size of instances of generic types might be erroneous because we can’t statically know the footprint of parameter types (except when they have the class constraint).
Recommendations: Types where SizeOfInst is higher than 64 might degrade performance (depending on the number of instances created at runtime) and might be hard to maintain. However it is not a rule since sometime there is no alternative (the size of instances of the System.Net.NetworkInformation.SystemIcmpV6Statistics third-party class is 2064 bytes). Non-static and non-generic types where SizeOfInst is equal to 0 indicate stateless types that might eventually be turned into static classes.
-
NbInterfacesImplemented: The number of interfaces implemented. This metric is available for interfaces, in this case the value is the number of interface extended, directly or indirectly. For derived class, this metric also count the sum of interfaces implemented by base class(es).
-
Association Between Class (ABC): The Association Between Classes metric for a particular class or structure is the number of members of others types it directly uses in the body of its methods.
-
Number of Children (NOC): The number of children for a class is the number of sub-classes (whatever their positions in the sub branch of the inheritance tree).
The number of children for an interface is the number of types that implement it.
In both cases the computation of this metric only count types declared in the application code and thus, doesn't take account of types declared in third-party assemblies.
-
Depth of Inheritance Tree (DIT): The Depth of Inheritance Tree for a class or a structure is its number of base classes (including the System.Object class thus DIT >= 1).
Recommendations: Types where DepthOfInheritance is higher or equal than 6 might be hard to maintain. However it is not a rule since sometimes your classes might inherit from third-party classes which have a high value for depth of inheritance. For example, the average depth of inheritance for third-party classes which derive from System.Windows.Forms.Control is 5.3.
Metrics on Methods
-
Method rank: MethodRank values are computed by applying the Google PageRank algorithm on the graph of methods' dependencies. A homothety of center 0.15 is applied to make it so that the average of MethodRank is 1.
Recommendations: Methods with high MethodRank should be more carefully tested because bugs in such methods will likely be more catastrophic.
Related Link::
Code metrics on Coupling, Dead Code, Design flaws and Re-engineering -
Afferent coupling at method level (MethodCa): The Afferent Coupling for a particular method is the number of methods that depends directly on it.
Related Link::
Code metrics on Coupling, Dead Code, Design flaws and Re-engineering -
Efferent coupling at method level (MethodCe): The Efferent Coupling for a particular method is the number of methods it directly depends on. Notice that methods declared in third-party assemblies are taken into account.
Related Link::
Code metrics on Coupling, Dead Code, Design flaws and Re-engineering -
IL Nesting Depth: The metric Nesting Depth for a method is the maximum number of encapsulated scopes inside the body of the method. The metric IL Nesting Depth is computed from the IL code. Values computed are very similar to what we would expect by computing them from the C# or VB.NET source code.
When you have a testing condition with N conditions, such as if( i > 9 && i < 12) then it is considered as N scopes because it is possible to decompose such conditions into N atomic conditions.
When a method has a large number of case statements corresponding to a switch, the C# and VB.NET compiler generally produce optimizations while generating the IL. In such case, the IL Nesting Depth corresponding value might be slightly higher to what you would expect.
Recommendations: Methods where ILNestingDepth is higher than 4 are hard to understand and maintain. Methods where ILNestingDepth is higher than 8 are extremely complex and should be split in smaller methods (except if they are automatically generated by a tool).
Related Link::
A simple trick to code better and to increase testability -
NbParameters: The number of parameters of a method. Ref and Out are also counted. The this reference passed to instance methods in IL is not counted as a parameter.
Recommendations: Methods where NbParameters is higher than 5 might be painful to call and might degrade performance. You should prefer using additional properties/fields to the declaring type to handle numerous states. Another alternative is to provide a class or structure dedicated to handle arguments passing (for example see the class System.Diagnostics.ProcessStartInfo and the method System.Diagnostics.Process.Start(ProcessStartInfo)).
-
NbVariables: The number of variables declared in the body of a method.
Recommendations: Methods where NbVariables is higher than 8 are hard to understand and maintain. Methods where NbVariables is higher than 15 are extremely complex and should be split in smaller methods (except if they are automatically generated by a tool).
-
NbOverloads: The number of overloads of a method. . If a method is not overloaded, its NbOverloads value is equals to 1. This metric is also applicable to constructors.
Recommendations: Methods where NbOverloads is higher than 6 might be a problem to maintain and provoke higher coupling than necessary. This might also reveal a potential misused of the C# and VB.NET language that since C#3 and VB9 support object initialization. This feature helps reducing the number of constructors of a class.
-
PercentageBranchCoverage: (defined for methods) Branch coverage is a more accurate measure of coverage than PercentageCoverage because it compensates for method complexity. Since branch coverage is generated from the underlying opcodes, it often does not map cleanly to source code. That means it’s difficult to take branch coverage values and determine how to write tests that will improve coverage.
Branch coverage is only available if your coverage data are imported from NCover or OpenCover coverage files and if the metric NbLinesOfCode is available.
Recommendations: The bottom line is:
- Use PercentageCoverage as your measure of quality, but
- Use PercentageBranchCoverage to determine which code statements need more testing.
It is also interesting to observe branch coverage values in conjunction with Code Source Cyclomatic Complexity values.
Metrics on Fields
-
Afferent coupling at field level (FieldCa): The Afferent Coupling for a particular field is the number of methods that directly use it.
Related Link::
Code metrics on Coupling, Dead Code, Design flaws and Re-engineering
Metrics on Source Files
-
Number of Lines: For a source file the number of lines is the number of line feed + 1 contained in it.
Number of Characters: Get the number of characters contained in a source file. Notice that this is not the size in bytes of the source file. If the source file has an encoding like UTF8, each ASCII character is coded on a byte and other characters can be coded on several bytes.