Code Rule and Code Query
Hundreds of default code rules to check against best practices. Support for Code Query over C# LINQ (CQLinq) to easily customize rules and query code.
Most companies have large systems that work together, often in mysterious ways. NDepend's in-depth reporting and toolset can help your company enforce its own coding standards and maintain complex projects.
Hundreds of default code rules to check against best practices. Support for Code Query over C# LINQ (CQLinq) to easily customize rules and query code.
Explore how the code is actually structured and shed light on architectural flaws thanks to the most powerful code dependency graph and dependency matrix available in the tool industry.
For each issue, the cost to fix and the severity are estimated through smart and customizable C# formulas. Thus estimations proposed are realistic.
A unique approach to continuously keep the technical debt under control and reimburse it with time.
Quality Gates are C# LINQ (CQLinq) queries that implement PASS/FAIL criteria to code quality.
Explore the issues-set in a few clicks and focus your effort on what is urgent and important.
Import test coverage data, and make the most of it in the NDepend feature-rich context.
NDepend allows your team to accurately gauge the overall health of your application, no matter how complex it is.
Get Trend Charts about pretty much any code metrics to master the evolution of your application.
Compare two versions of a code base and its issues set, and browse diff and changes in any way you can think of.
Be warned of potential build process problems before they end up causing friction and pain.
NDepend's reporting and analysis helps architects and developers to communicate and reduce confusion.
Integrate NDepend analysis into your build process and get highly customized and detailed reports to see progression and prevent code quality degradation.
Spot too complex code at a glance thanks to unique diagramming capabilities.
Lines of Code, Cyclomatic Complexity, Coupling, Nesting Depth, Rank, NDepend supports them all (and much more).
By mapping out the structure of the project, it is much easier to see how components and dependencies are connected.
Get rid of dependency cycles between components to achieve higher code maintainability.
NDepend helps maintaining clean side-effects free code to write highly maintainable products.
Full Visual Studio and Azure DevOps integration, super fast and lightweight analysis, integration within all CI/DevOps systems, NDepend is conceived for real-world programmers.
Write your own static analyzer based on NDepend.API, or tweak existing open-sources Power Tools.
There are many ways to measure a code base. The most common way is to count the number of lines of code. This metric gives a rough estimation of the effort that had been put in to develop the code base. It also allows you to obtain a quality level agreement by pinpointing fat methods and classes.
NDepend counts the number of lines of code. It also comes with 82 other code metrics. Some of them are related to your code organization (the number of classes or namespaces, the number of methods declared in a class...), some of them are related to code quality (complexity, percentage of comments, number of parameters, cohesion of classes, stability of assemblies...), some of them are related to the structure of code (which types are the most used, depth of inheritance...) and some of them are related to code coverage (%coverage, number of lines of code covered, branch coverage...).
NbLinesOfCode, NbLinesOfComment, PercentageComment, NbILInstructions, NbAssemblies, NbNamespaces, NbTypes, NbMethods, NbFields, PercentageCoverage, NbLinesOfCodeCovered, NbLinesOfCodeNotCovered
NbLinesOfCode, NbLinesOfComment, PercentageComment, NbILInstructions, NbNamespaces, NbTypes, NbMethods, NbFields, Afferent coupling (Ca), Efferent coupling (Ce), Relational Cohesion(H), Instability (I), Abstractness (A), Distance from main sequence (D), PercentageCoverage, NbLinesOfCodeCovered, NbLinesOfCodeNotCovered
NbLinesOfCode, NbLinesOfComment, PercentageComment, NbILInstructions, NbTypes, NbMethods, NbFields, Afferent coupling at namespace level (NamespaceCa), Efferent coupling at namespace level (NamespaceCe), PercentageCoverage, NbLinesOfCodeCovered, NbLinesOfCodeNotCovered
NbLinesOfCode, NbLinesOfComment, PercentageComment, NbILInstructions, NbMethods, NbFields, NbInterfacesImplemented, Type rank, Afferent coupling at type level (TypeCa), Efferent coupling at type level (TypeCe), Lack of Cohesion Of Methods (LCOM), Lack of Cohesion Of Methods Henderson-Sellers (LCOM HS), Code Source Cyclomatic Complexity, IL Cyclomatic Complexity (ILCC), Size of instance, Association Between Class (ABC) Number of Children (NOC), Depth of Inheritance Tree (DIT), PercentageCoverage, NbLinesOfCodeCovered, NbLinesOfCodeNotCovered
NbLinesOfCode, NbLinesOfComment, PercentageComment, NbILInstructions, Method level, Method rank, Afferent coupling at method level (MethodCa), Efferent coupling at method level (MethodCe), Code Source Cyclomatic Complexity, IL Cyclomatic Complexity (ILCC), IL Nesting Depth, , NbParameters, NbVariables NbOverloads PercentageCoverage, NbLinesOfCodeCovered, NbLinesOfCodeNotCovered, PercentageBranchCoverage
Size of instance, Afferent coupling at field level (FieldCa)
NDepend also provides some facilities that will help you to detect metric anomalies and to fix your own thresholds.
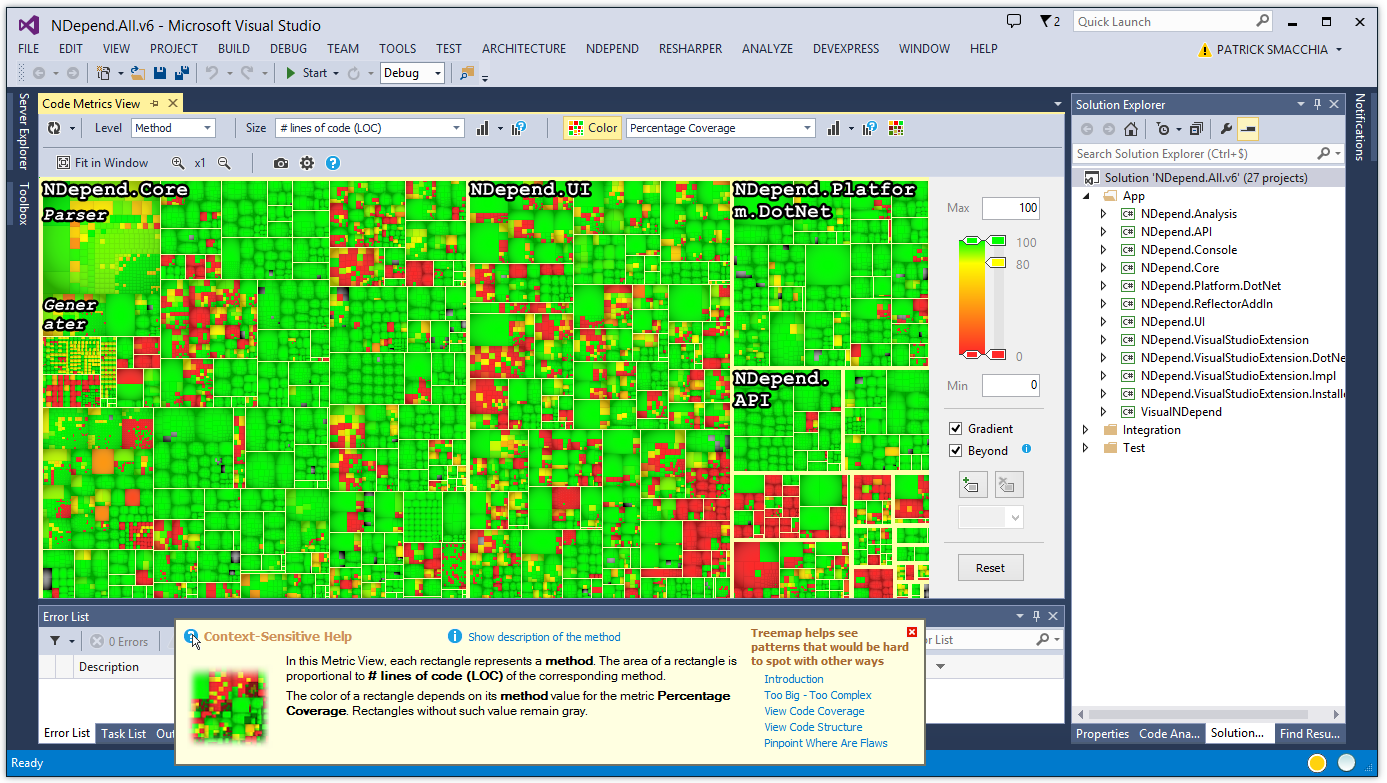
The NDepend UI displays an interactive view of code metrics of your .NET applications. Such a view can be tuned according to numerous software metrics and can be saved in a PNG file in order to let you print posters.
For example see below a screenshot below of the metric view on the NDepend code base:
Related Links::
Mythical man month : 10 lines per developer day
Interview of our Lead Developer by Scott Hanselman about Metrics (35mn)