
Getting Started with NDepend on Windows
- Either watch the 5 minutes video below...
- ... or read the tutorial with explanations and screenshots
- Once you got the product installed and running don't miss out the Walkthrough Videos and the Use Cases pages.
Getting started with NDepend (5mn)
Tutorial with explanations and screenshots
- Installing the NDepend extension for Visual Studio 2026, 2022, 2019, 2017, 2015, 2013, 2012 or 2010
- Analyzing a Visual Studio solution
- Analyzing a .NET applications using Visual NDepend
Installing the NDepend extension for Visual Studio 2026, 2022, 2019, 2017, 2015, 2013, 2012 or 2010
- Download the NDepend installation zip file
- To install NDepend, just unzip the files in a private application folder on your machine. Don't unzip files in '%ProgramFiles%\NDepend'. This might provoke problems because of Windows protection.
- If you are running NDepend Professional Version, just type your license key in the NDepend activation dialog to activate your machine.
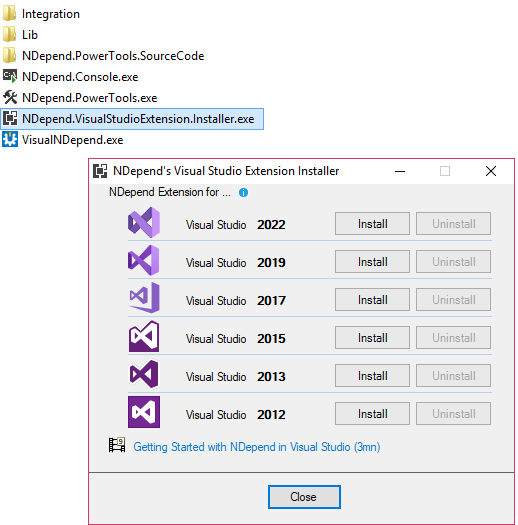
- Start NDepend.VisualStudioExtension.Installer.exe
-
Click the button Install for the right Visual Studio version
- Start Visual Studio

Analyzing a Visual Studio solution
- Start Visual Studio after having installed the NDepend addin.
- Open the Visual Studio solution containing the code to analyze.
-
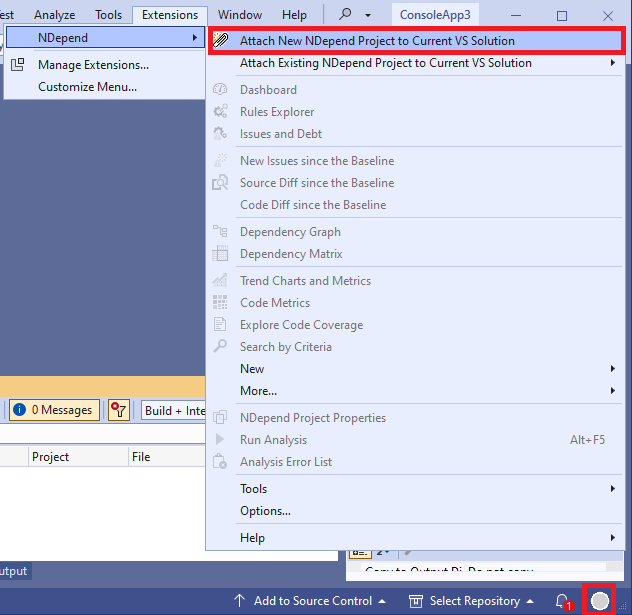
Click the greyed NDepend circle status (bottom right of the Visual Studio window)
OR
click the menu NDepend > Attach new NDepend project to current Visual Studio solution
-
Note:
- A NDepend project can be attached to several Visual Studio solutions.
- This is useful if you wish to analyze several .NET assemblies compiled with several Visual Studio solutions.
- A benefit will be the possibility to navigate across several Visual Studio solutions opened in several Visual Studio instances.
-
The dialog opened proposes to create a new NDepend project (.ndproj file extension)
that references the Visual Studio solution .sln file.
This NDepend project file will be then referenced by the .sln file, this is how it is attached to it.
By default projects containing test in their names are filtered out, they are not analyzed. If needed you can modify the filter(s).
You can also reference more assemblies from the tab No assembly outside the VS solution will be analyzed.
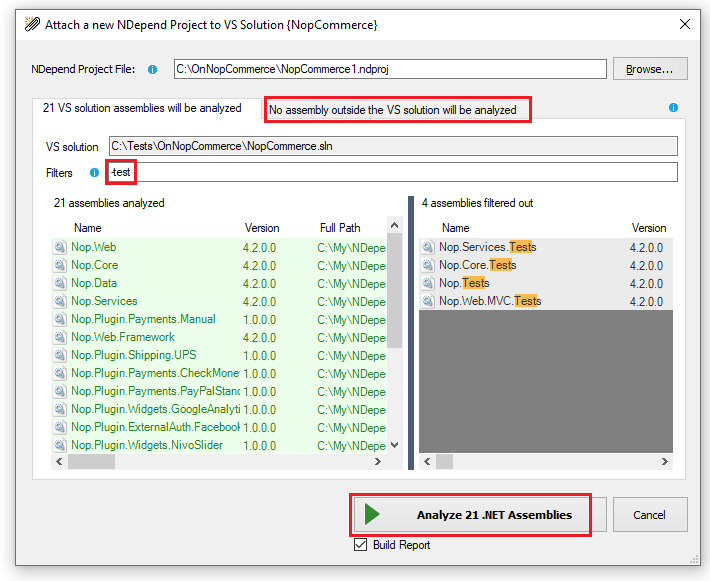
- Click Ok : the NDepend analysis start. It will just take a few seconds to analyze your code base for the first time. If you let the Build Report check box checked, a report will be created and shown in a new browser window.

Analyzing a .NET applications using Visual NDepend
The NDepend Visual Studio extension has no impact on the Visual Studio process performances. However if you prefer you can use 100% of NDepend features outside Visual Studio thanks to the standalone executable VisualNDepend.exe. To do so:
- Start VisualNDepend.exe
-
Select one of the options:
- Analyze Visual Studio solutions and Visual Studio projects
- Analyze .NET assemblies in folder
- Analyze a set of .NET assemblies
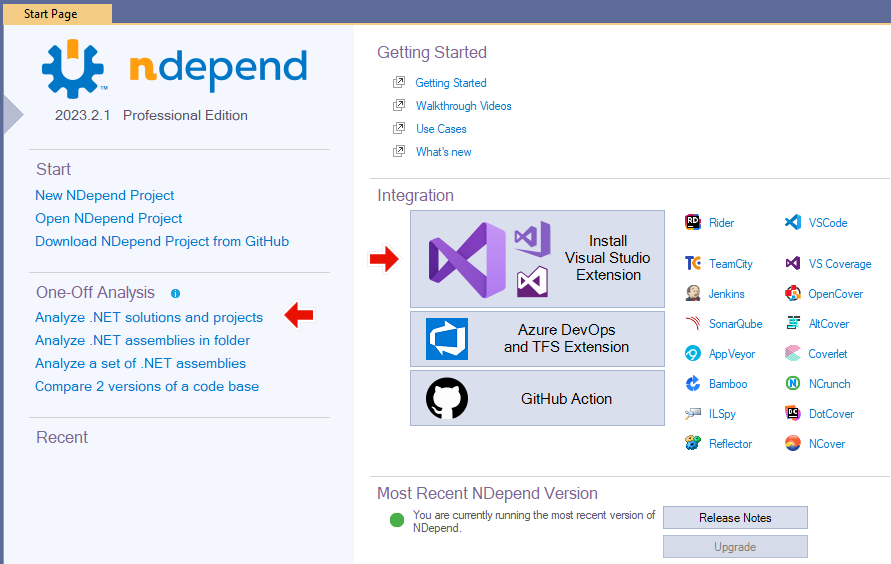
- Click OK. It will trigger the analysis of your assemblies and code source by NDepend.Console.exe. This analysis will take a few seconds. Once done, the result is displayed in the VisualNDepend.exe UI.
Sample Reports
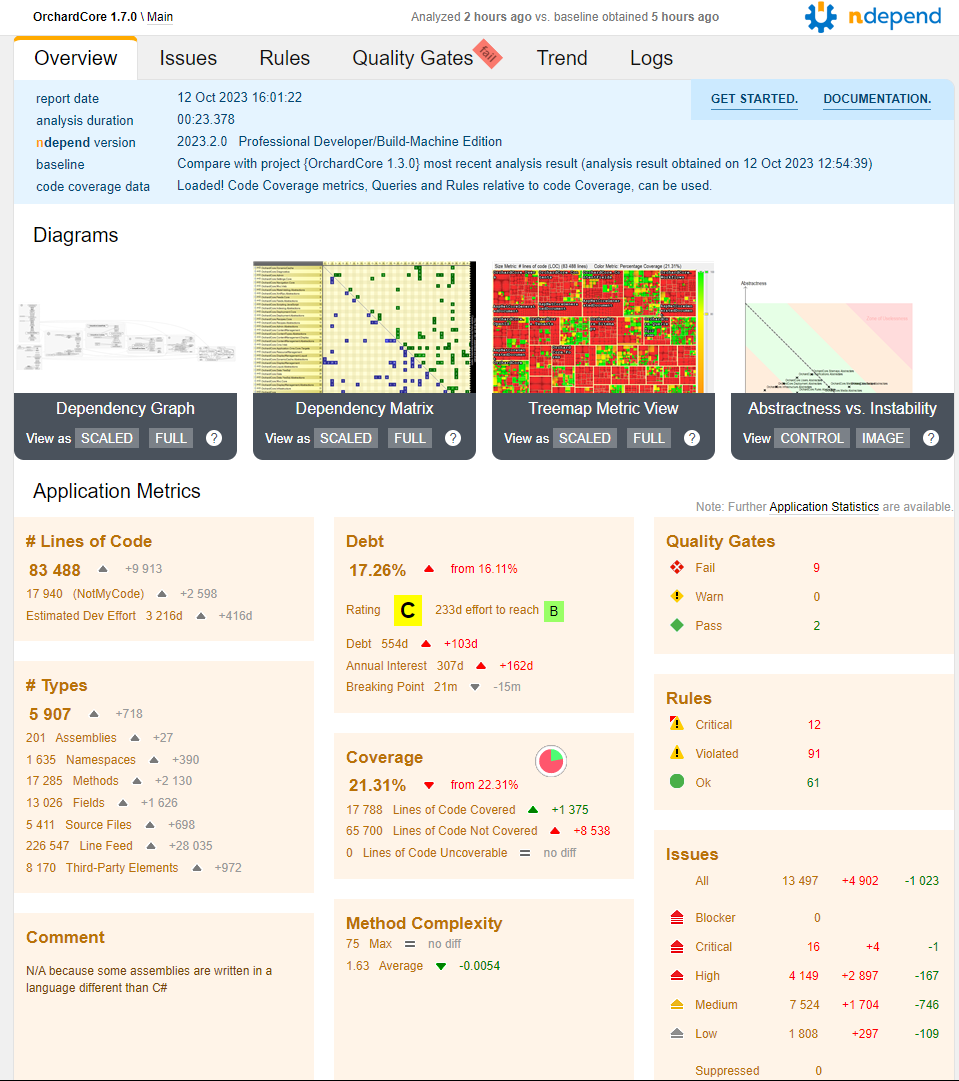
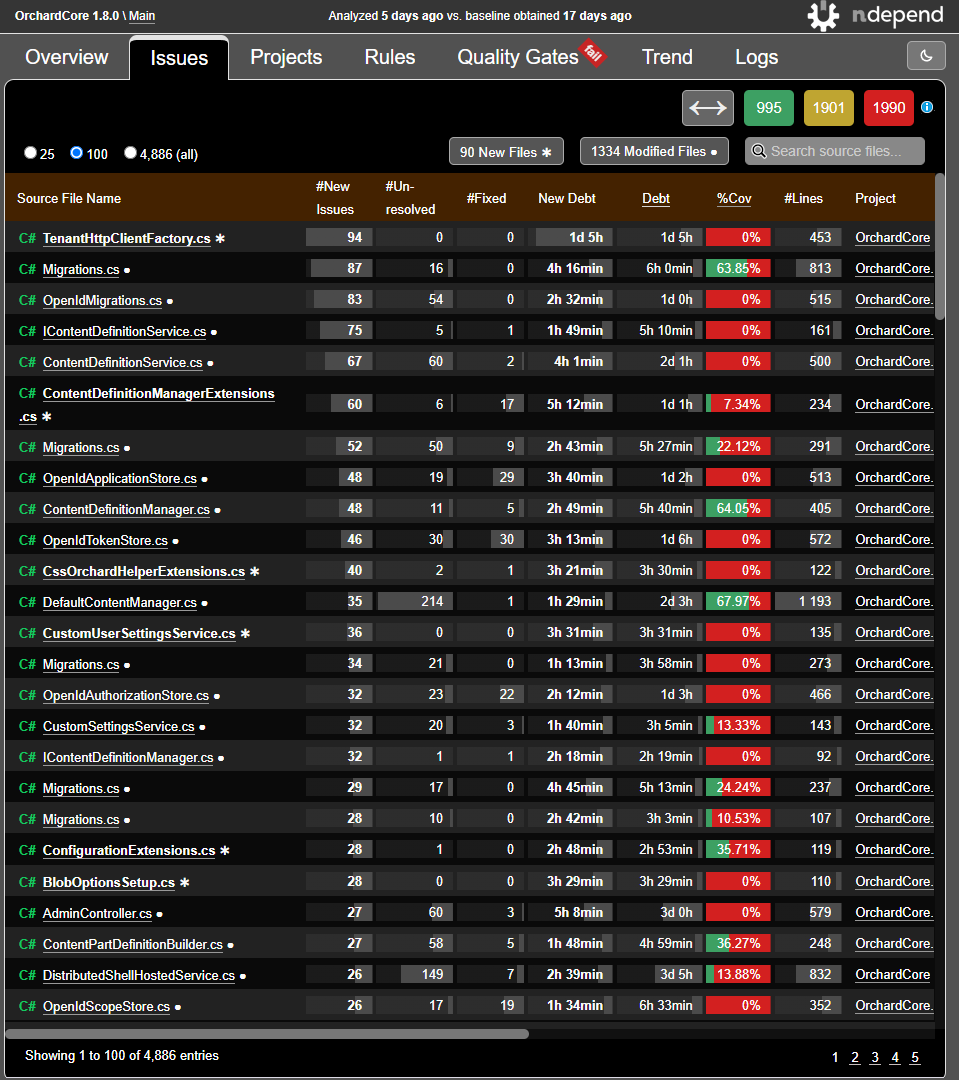
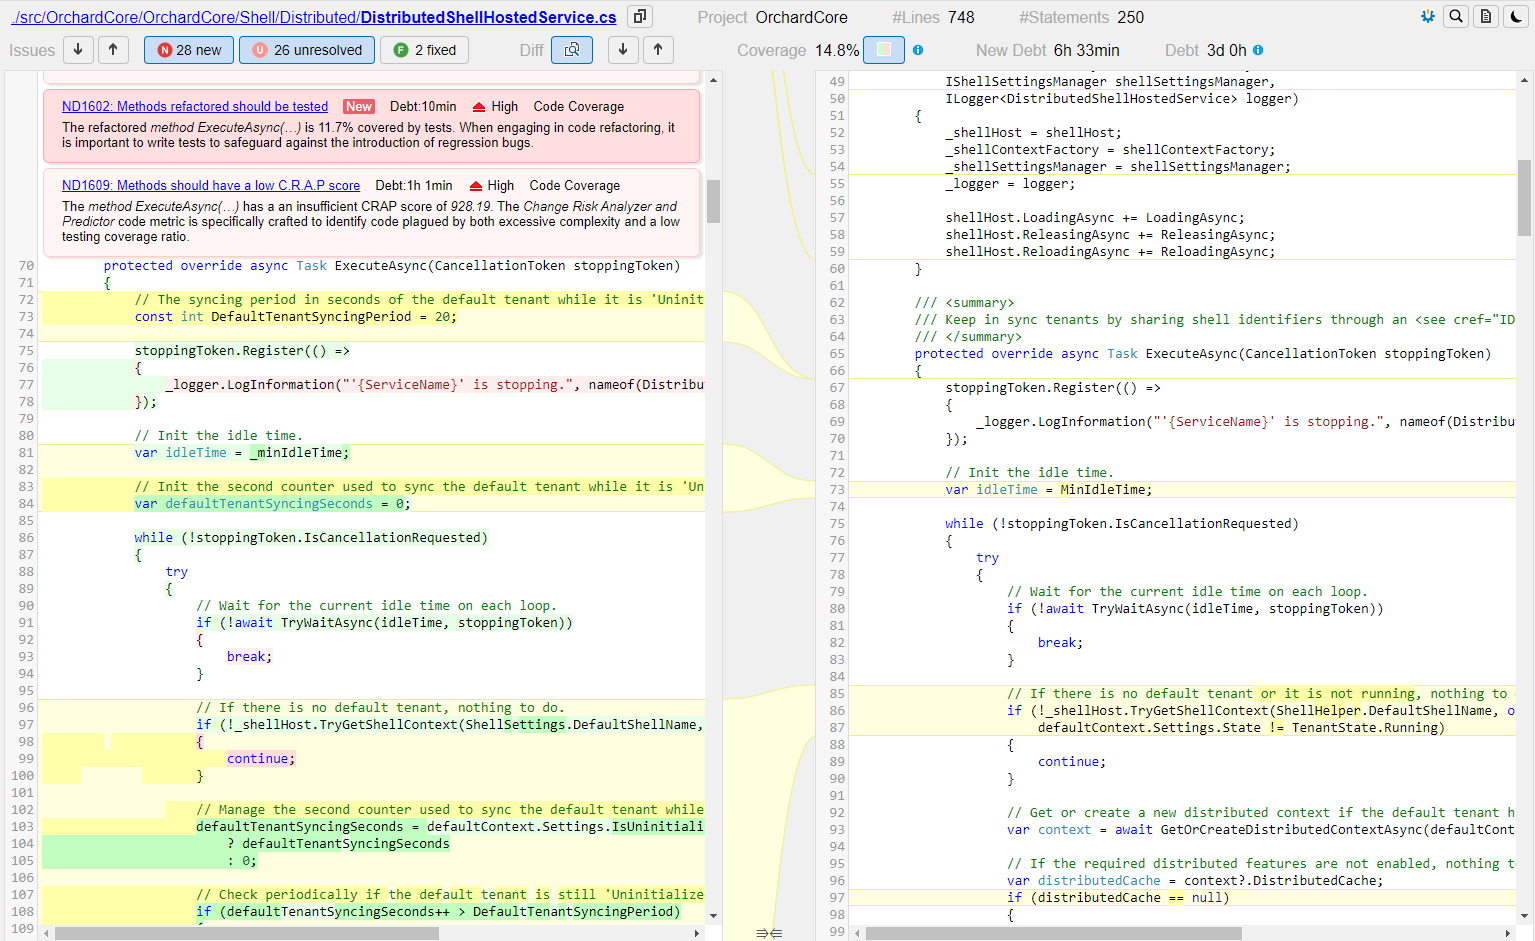
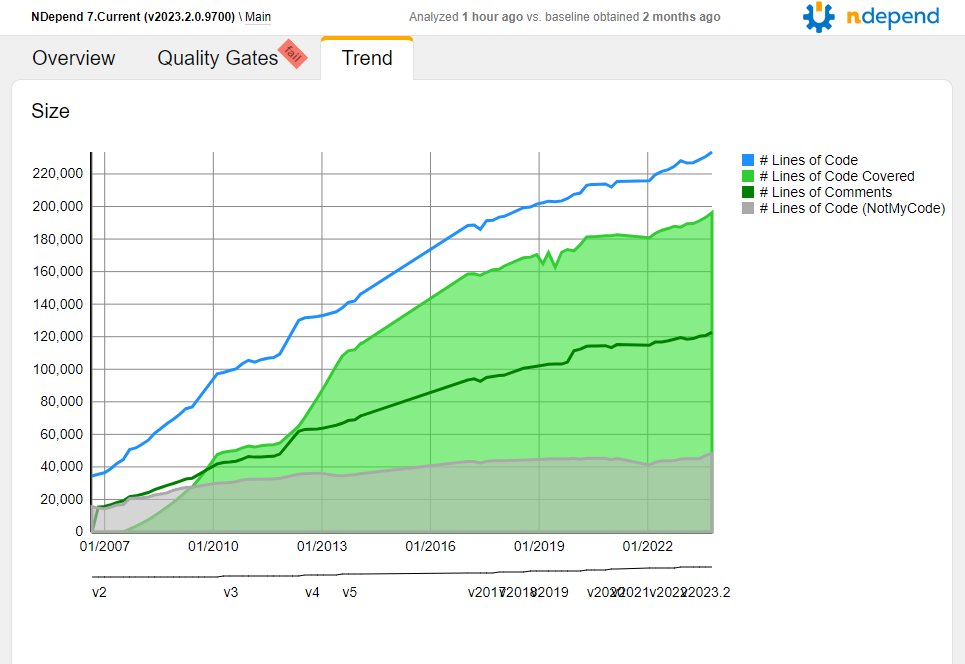
NDepend generates interactive web reports that provides valuable and detailed insights about your .NET code quality:
For all sample reports are imported:
Such serverless report can be generated by invoking... NDepend.Console.exe $absolute-path-to-an-NDepend-project-file$...from your CI/CD running on Windows, Linux and Mac
You can generate the report using a trial license, a Build-Machine license |
|
Use Cases
NDepend is a feature rich product. To help you get started quickly you can refer to the use cases that best fulfill your needs: