
Exploring the Code Architecture in Visual Studio through Dependency Graph
The NDepend dependency graph has been completely rebuilt within NDepend version 2020.1 released in April 2020. You might have used the NDepend dependency graph in the past but the new graph is certainly worth a try because it represents an important milestone in how code can be explored and navigated.
- NDepend Dependency Graph : 6 Minutes Walkthrough Video
- Dependency Graph Main Concepts and Tools
- The Default Application Map
- Layout Bar, Navigation Bar and Help Bar
- Search in the NDepend Dependency Graph
- Drag and Drop Files and Directories From the Visual Studio Solution Explorer
- Exporting Visual Studio Code Elements to the NDepend Dependency Graph
- Visualizing Large Graph Made of Thousands of Elements
- Complex Graph Simplified with Cluster Elements
- Group-By
- Filters
- Export to SVG vector Format and PNG bitmap format
- Graph Persistence
- Call Graph
- Class Inheritance Graph
- Coupling Graph
- Changes Map
- Exhibit Monolithic Portions of Code
- Path Graph
- All Paths Graph
- Cycle Graph
NDepend Dependency Graph : 6 Minutes Walkthrough Video
Dependency Graph Main Concepts and Tools
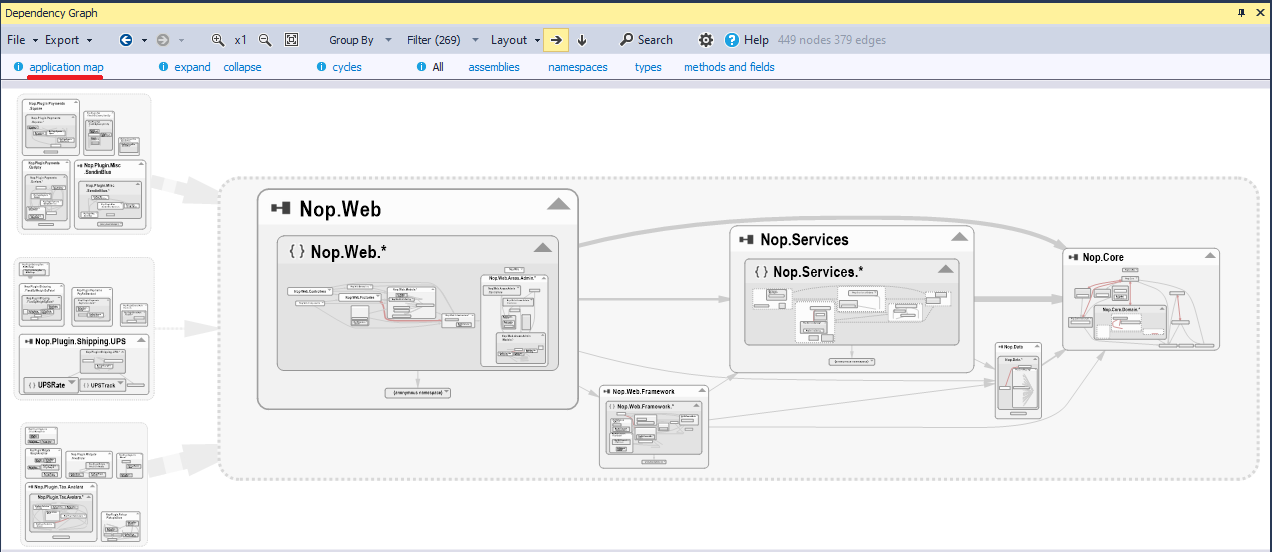
The Default Application Map
Depending on the size of the application the default application map is made of application assemblies, namespaces, types or members. The algorithm to chose the level of elements shown on map is simple: it attempts to have around 1.000 elements.
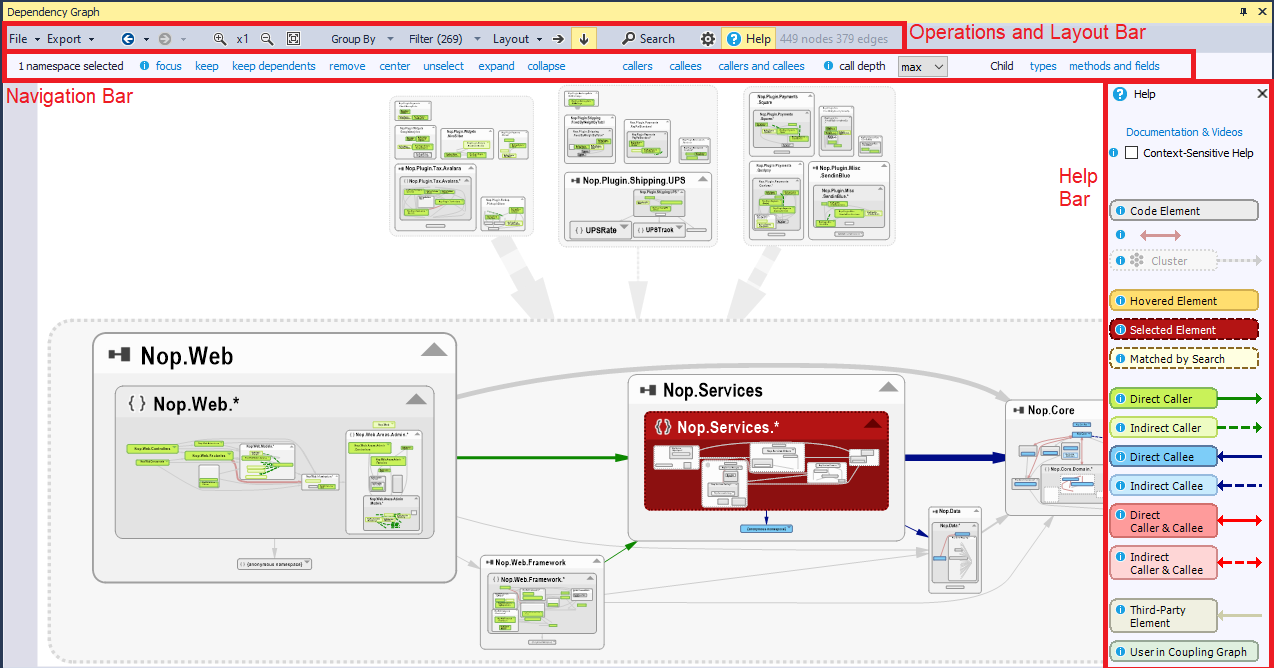
Layout Bar, Navigation Bar and Help Bar
Per default 3 bars surround the dependency graph:
- Operations and Layout Bar: Graph persistence ; Export Graph to vector SVG or bitmap PNG ; Undo/Redo actions on graph ; Zoom ; Group-By ; Filter elements ; Layout options ; Search ; Options ; Show / Hide Help Bar
Notice that the Layout Direction choosen only applies to the top-graph. NDepend has an heuristic to determine which layout direction is best suited for sub-graph (graphs nested is top graph boxes). If you have a top-graph with a single (or few) parent box(es), you can use the un-Group-By setting to make sure that the sub-graph(s) in the top-graph box(es) become the top-graph. This way the Layout Direction applies to it. - Navigation Bar:
- If no element selected : application map ; expand/collapse all ; graph of changes ; graph of entangled namespaces ; graph of all assemblies, namespaces, types, methods and fields
- If one or several elements selected show some actions on these elements: keep ; remove ; expand/collapse ; center ; unselect ; callers/callees ; children
- When searching proposes to keep or remove elements matched.
- Help bar: Shown per default ; Explains the color convention green for callers elements, blue for called elements, red for entangled elements.
Search in the NDepend Dependency Graph
Search for elements by name on large graphs consisting of hundreds or thousands of elements in real-time.
Matched elements can be kept or removed.
A NDepend Search by Name panel is opened. It supports various search options and regex as well.
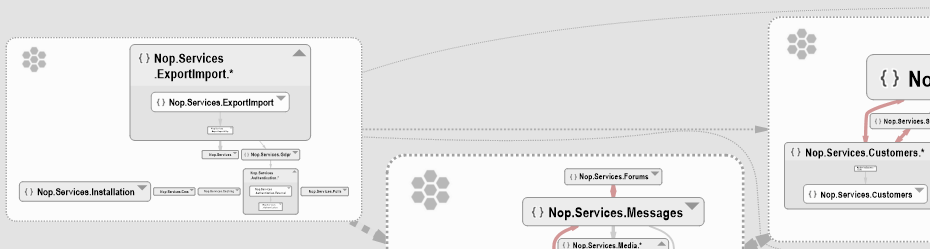
The short animation below searches all namespaces whose names contain the string customer, selects them and then expands them to show all their children classes.
Drag and Drop Files and Directories From the Visual Studio Solution Explorer
Files and Directories in the Visual Studio Solution Explorer can be dragged and dropped onto the graph.
Exporting Visual Studio Code Elements to the NDepend Dependency Graph
In the Solution Explorer (or Code Editor window) right-click an element proposes two menus:
Show on Dependency Graph: generate a graph of callers/callees/children of the element righ-clicked.
Append the element right-clicked to graph.

Visualizing Large Graph Made of Thousands of Elements
The architecture of large applications can be explored and navigated live.
The short animation below shows a graph made of 15,000+ classes of .NET Core 3 with a zoom on System.String and then System.Dictionary<K,V>.
Complex Graph Simplified with Cluster Elements
Cluster elements are automatically introduced to simplify complex graphs into readable graphs.
This feature can be disabled from the Group-By options.
Two cluster level are proposed:
- Cluster Complex Assembly Set: When set, this applies when there is more than 20 assemblies to show. An heuristic appends cluster nodes that are grapes of assemblies to simplify the assembly graph. If referenced assemblies like ASP.NET Core assemblies are shown on a graph, they get their own clusters.
- Cluster Complex Element Set: When set, this applies to all sub-graphs made of namespaces, types or methods and fields, that contain more than 20 elements. Thanks to cluster nodes added such sub-graph gets simplified.
Visually cluster nodes have an hexagonal honeycomb icon and their borders are dotted. Edges between cluster nodes are also dotted.
Group-By
Elements shown on graph can be grouped by:
- Parent Assemblies
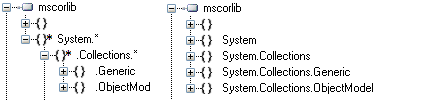
Parent Namespaces (Tree or Flat)
- Parent Types
- Clusters of Assemblies: This option is useful when there is dozens or hundreds of Assemblies to show. And also to group Third-Party Assemblies like System or ASP.NET Core Assemblies
- Clusters of Elements: This option is useful for example when a namespace contains dozens or hundreds of types that couldn't be well arranged within a single graph.

Filters
So far 3 filters are proposed:
- Exclude generated code elements (types, methods and fields with the value true for IMember.IsGeneratedByCompiler)
- Exclude third-party code elements (System or other third-party like the ASP.NET Core framework classes)
- Exclude non-public code elements, useful to view only public APIs elements on graph
Per default only the Exclude third-party code elements filter is activated.
Note that the number in parenthesis near Filter counts the number of code elements actually filtered-out.

Export to SVG vector Format or PNG bitmap format
The Export menu lets export a graph to SVG vector Format or PNG bitmap format.
Elements of a graph can also be exported to the dependency matrix.
Click the images below to open some SVG vector graph in your browser.


Graph Persistence
A graph can be persisted in a .ndgraph file and then restored.
.ndgraph files are referenced by the NDepend project.
Instead of saving a list of elements shown on graph, the list of actions that leads to the persisted graph is persisted. This way the graph remains in-sync with changes when the code changes.
If a pivot element is missing, like for example when attempting to restore an inheritance graph rooted on a base class removed or renamed, the load operation fails and a message is shown to the user explaining that a pivot element cannot be found by name.
Call Graph
There are two ways to generate a call graph:
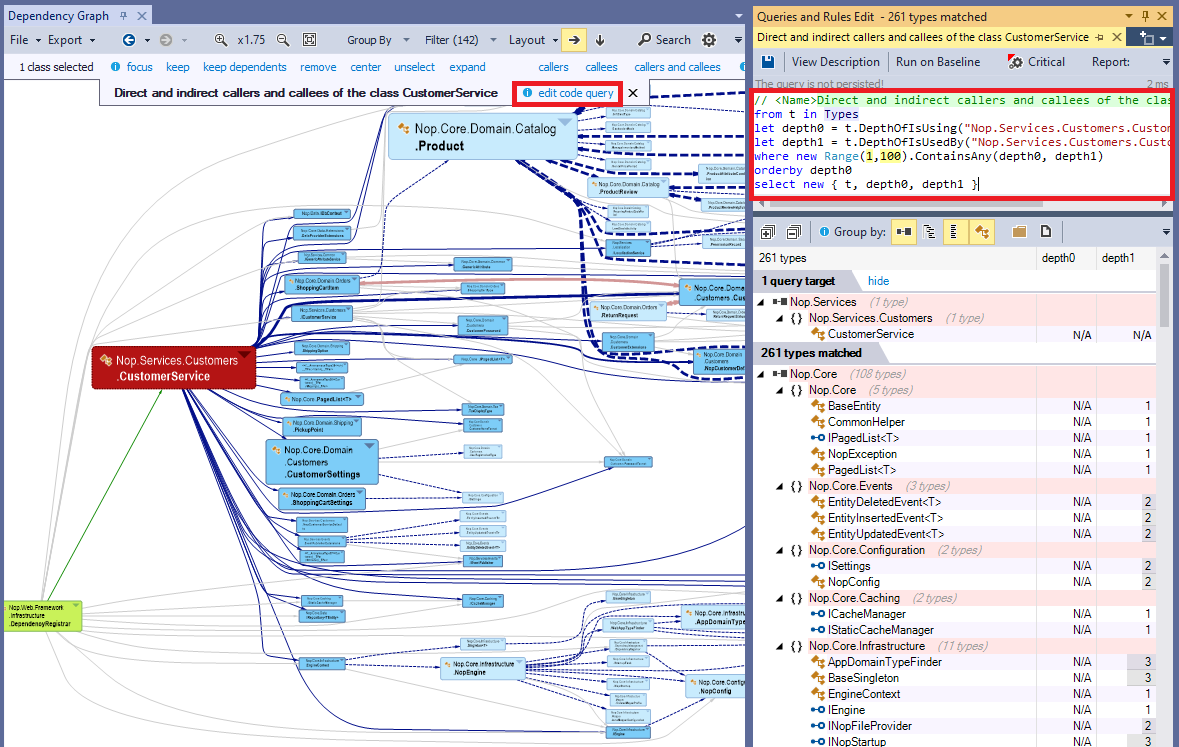
- Select one or several elements and in the navigation bar click callers, callees, callers and callees. The call depth can be chosen.
In the background a code query is generated and can be edited through the edit code query link.
- Second way to generate a call graph: Select one or several elements. Caller elements are colored in green, callees elements are colored in blue, entangled elements are colored in red. The link keep dependents prune the non-colored elements.
Class Inheritance Graph
To get an inheritance graph just select one or several interfaces and click the link Classes Implementer in the navigation bar, or select one or several base classes and click the link Derived Classes in the navigation bar.
Coupling Graph
It is often needed to know the types and methods involved in the coupling between two assemblies or two namespaces. Especially when we want to anticipate the impact of a refactoring.
Any edge can be clicked in the NDepend dependency graph. The two elements are then selected and the links coupling graph and coupling matrix are shown in the navigation bar to explore the coupling.
Double-clicking an edge also generates the coupling graph between the two elements.
In the background a code query is generated and can be edited through the edit code query link. The result of the query shows in details who calls who.
Tips: You might want to generate a coupling graph between 2 code elements not of the same kind, like an assembly and an interface for example. Typically there is no edge between 2 code elements not of same kind because of grouping options. However you can still select the 2 elements in the graph and the navigation menu will propose the coupling graph / matrix menus.
Changes Map
When a baseline is available and no element is selected the navigation bar shows the changes map link.
Clicking this link opens the search by change panel that matches all code elements added or refactored since the baseline.
A new graph is then generated made of these code elements added or refactored since the baseline..
Exhibit Monolithic Portions of Code
When no element is selected the navigation bar shows the cycles link.
Clicking this link edits the code rule Avoid namespaces dependency cycles.
From there you can export the elements that form a cycle to the graph. Below we can see a graph made of 30 entangled namespaces.
They form a large monolithic portion of code: all these namespaces depend on each other.
To dis-entangle such monolithic portion of code, it is advised to:
- 1) Transform each double-side edge (in red) into a single sided edge. For that double clicking a red edge shows a new graph made of types and methods involved into the two sided coupling.
- 2) Remove all remaining cycles to layer the entire structure.
Path Graph
If you wish to dig into a path or a dependency cycle between 2 code elements, the first thing to do is to show the dependency matrix with the option Weight on Cells: Direct & indirect depth of use.
Matrix blue and green cells will represent paths while black cells will represent dependency cycles. For example, here, the Info panel tells us that there is a path of minimal length 6 between the 2 types involved.
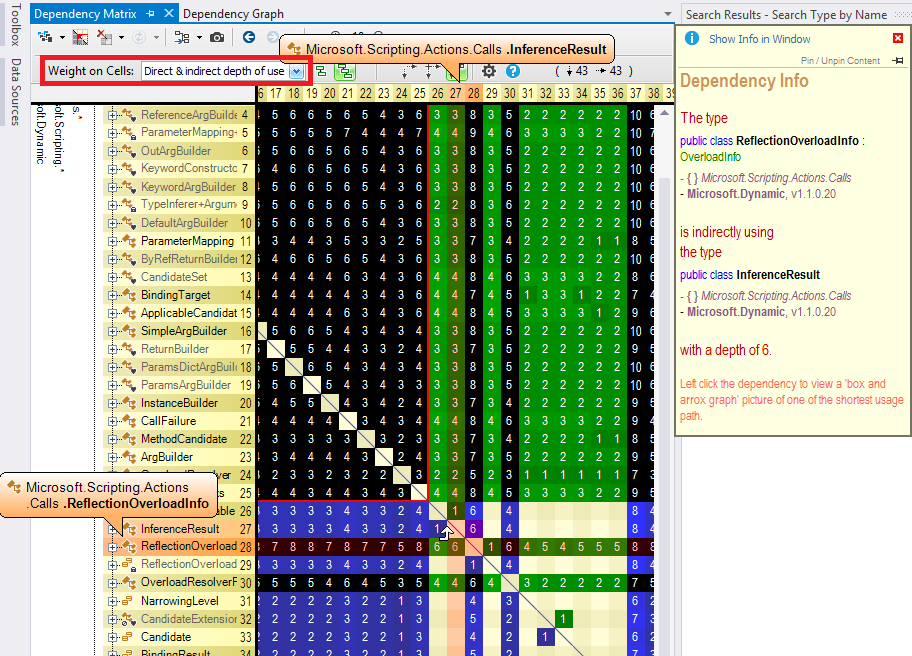
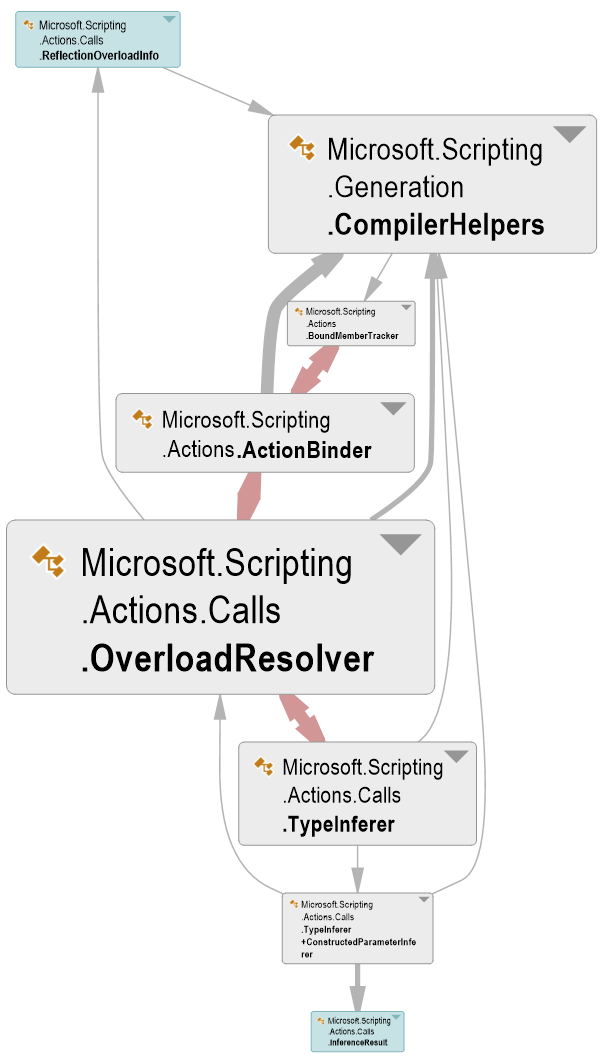
Just left clicking the cell shows the path graph below.
All Paths Graph
In certain situations, you'll need to know about all paths from a code element A to a code element B. For example, here, the Info panel tells us that there is a path of minimal length 2 between the 2 types involved.
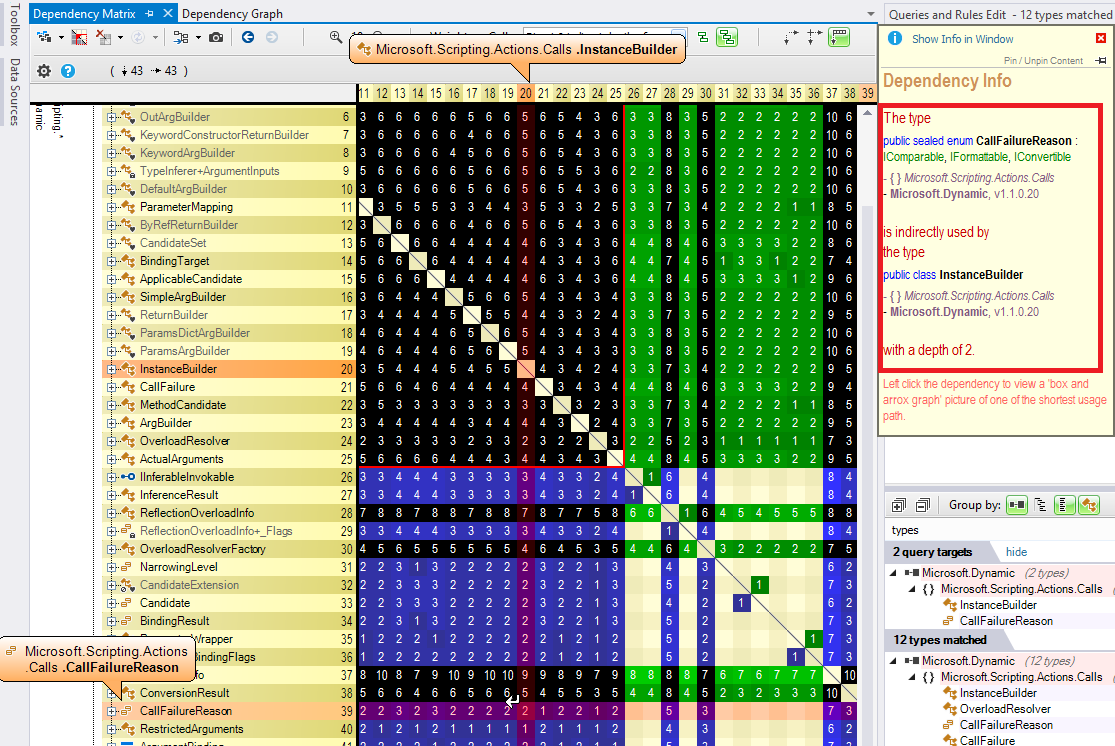
Right clicking the matrix's cell and selecting the option Edit a code query that matches paths generates the following CQLinq query that matchs all types involved in all paths from type A to type B.
from t in Types
let depth0 = t.DepthOfIsUsedBy("Microsoft.Scripting.Actions.Calls.InstanceBuilder")
let depth1 = t.DepthOfIsUsing("Microsoft.Scripting.Actions.Calls.CallFailureReason")
where depth0  <= 2 && depth1  <= 2
orderby depth0, depth1
select new { t, depth0, depth1 }
//--------------------------------------------------------------------
// The type
// public class InstanceBuilder
// - { } Microsoft.Scripting.Actions.Calls
// - Microsoft.Dynamic, v1.0.0.0
//
// is indirectly using
// the type
// public sealed enum CallFailureReason : IComparable, IFormattable, IConvertible
// - { } Microsoft.Scripting.Actions.Calls
// - Microsoft.Dynamic, v1.0.0.0
//
// with a depth of 2.

Finally exporting to the graph the 12 types matched by the CQLinq query, shows all paths from A to B.
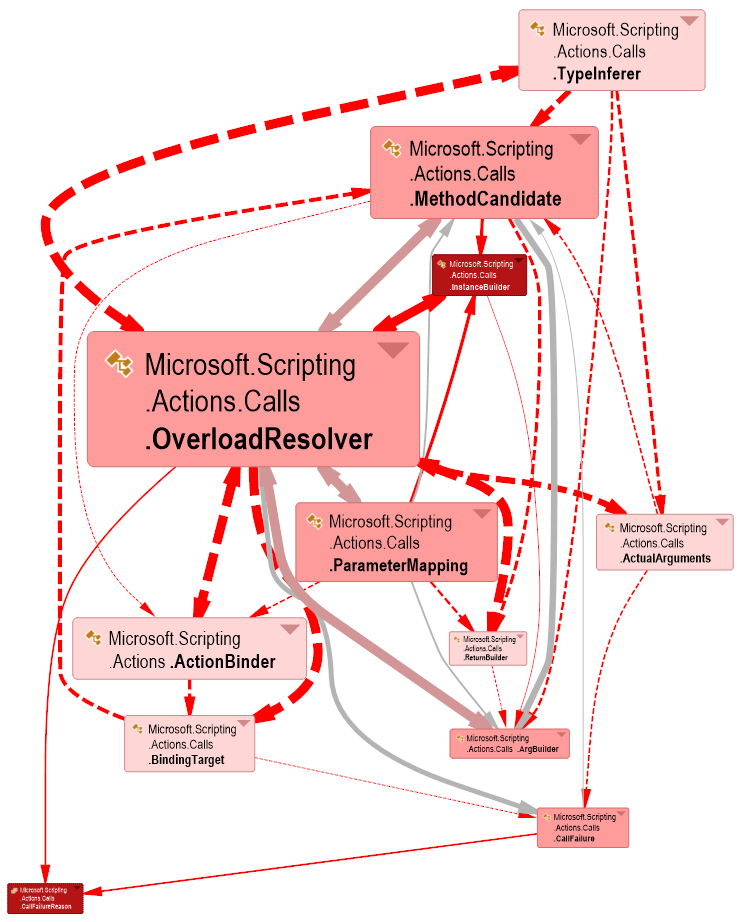
Cycle Graph
As we explained in the previous section, to deal with dependency cycle graphs, the first thing to do is to show the dependency matrix with the option Weight on Cells: Direct & indirect depth of use. Black cells then represent cycles.
For example, here, the Info panel tells us that there is a dependency cycle of minimal length 5 between the 2 types involved.
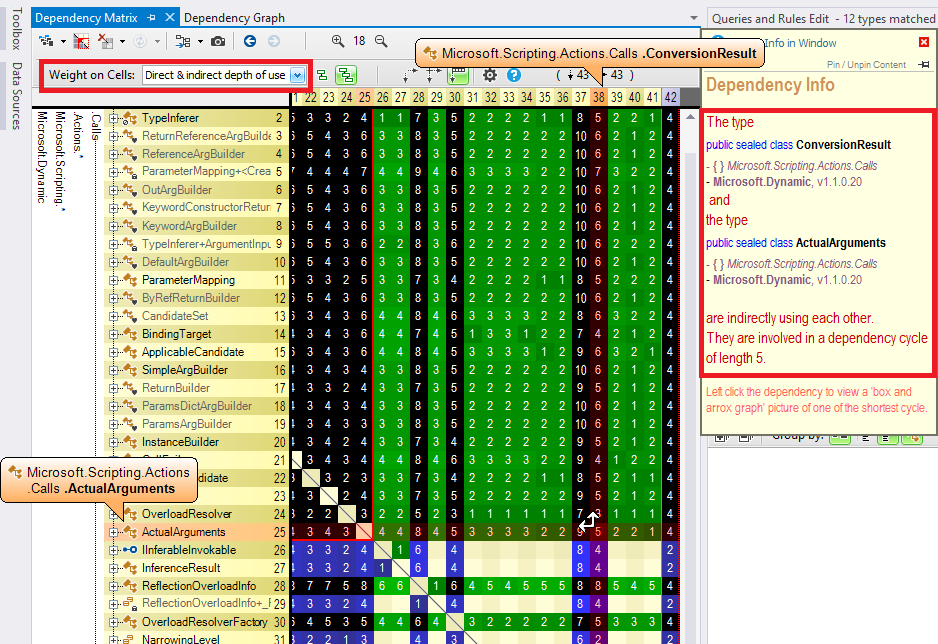
Just left clicking the cell shows the cycle graph below.

We can indeed follow a cycle from ActualArgument till ConversionResult.