Project Dependency Diagram
- The Default Project Dependency Diagram : the Application Map
- Get only Projects in the Dependency Diagram
- Clusters to Visualize Large Projects Dependency Diagram
- Project Element Size
- Project's References
- Search Projects
- Project's Dependents
- Explore Classes in a Project
- Explore Classes Involved in the Coupling between 2 Projects
- Export a Project Dependency Diagram
- Architecture of a .NET Application: Case Studies
Real-world large applications are made of dozens, if not hundreds, of Visual Studio projects. It is essential to rely on a project dependency diagram to understand, navigate and keep the control of a complex Visual Studio solution.
With NDepend in Visual Studio, just click NDepend > Dependency Graph to get instantly a dependency diagram of the projects of your Visual Studio solution’s projects.
Such project dependency diagram can be browsed, zoomed and exported to a PNG image or an SVG vector graph.
Thanks to the navigation bar, the project dependency diagram represents a great starting point to explore your code base.
The Default Project Dependency Diagram : the Application Map
By default the NDepend graph shows a graph named the Application Map.
At anytime you can go back to this project dependency diagram by clicking application map in the navigation bar. Make sure that no element is selected on the graph else the navigation bar shows menus related to selected element(s).
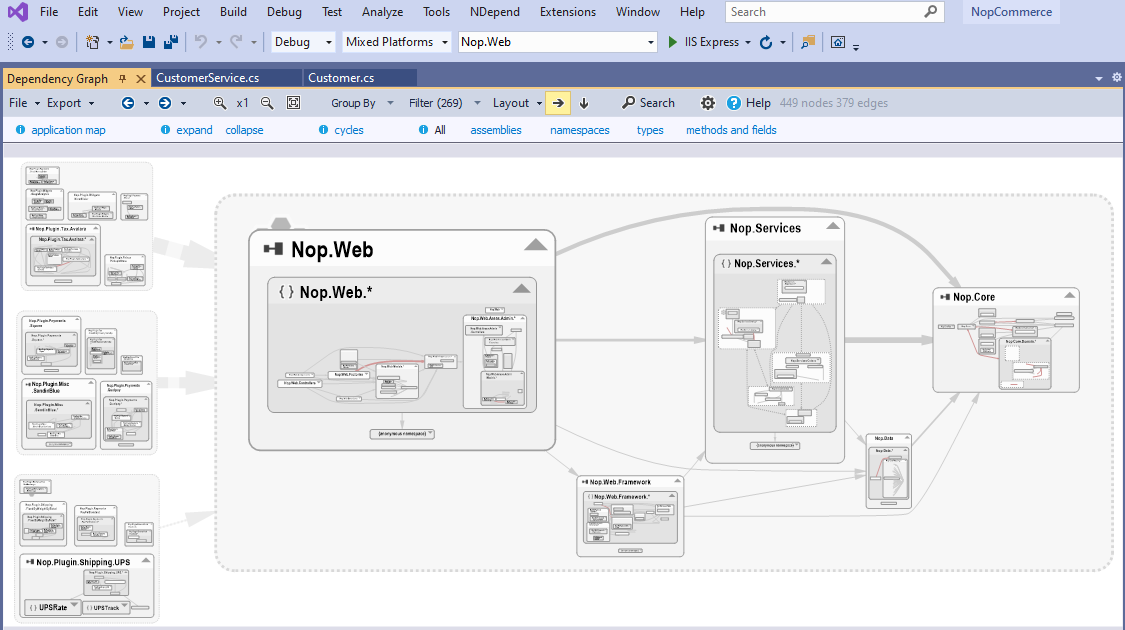
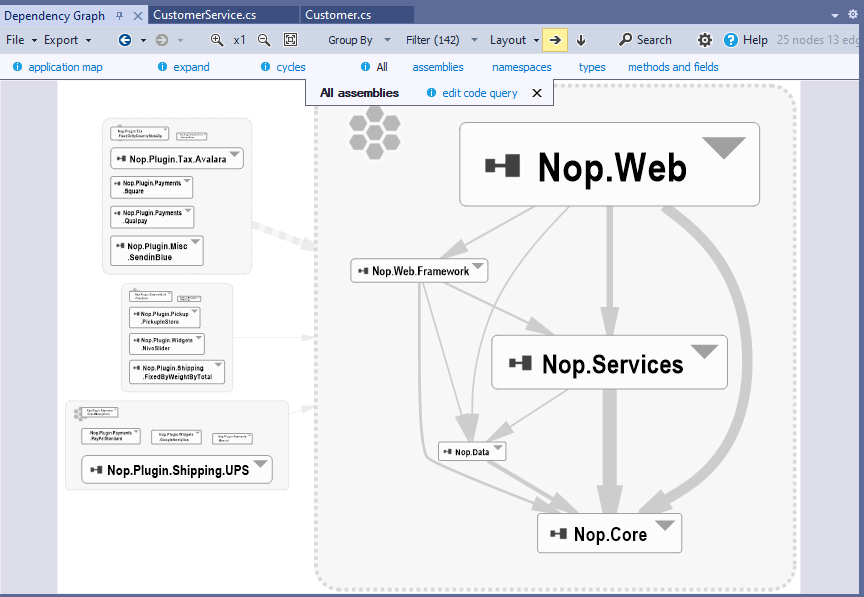
Get only Projects in the Dependency Diagram
The application map heuristic actually attempts to show around 1.000 elements. In the picture above there are 21 projects so the heuristics choose to go down till namespaces level to finally shows 449 elements. If you want a graph made of only projects you can either click All ... assemblies in the navigation bar or click collapse several times.
Clusters to Visualize large Projects Dependency Diagram
In the screenshot above projects are grouped into parent clusters nodes. This is because an heuristic estimated that the graph would be clearer with clusters. To discard clustering just un-check Group By > Cluster Complex Assembly Sets:
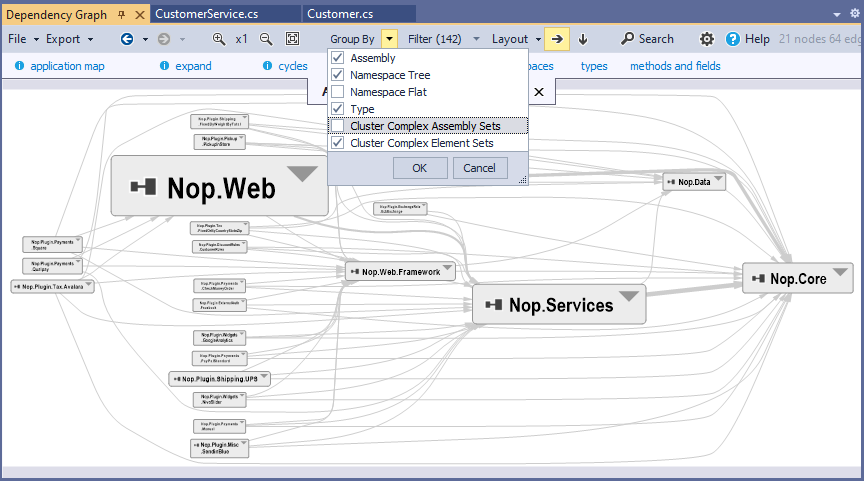
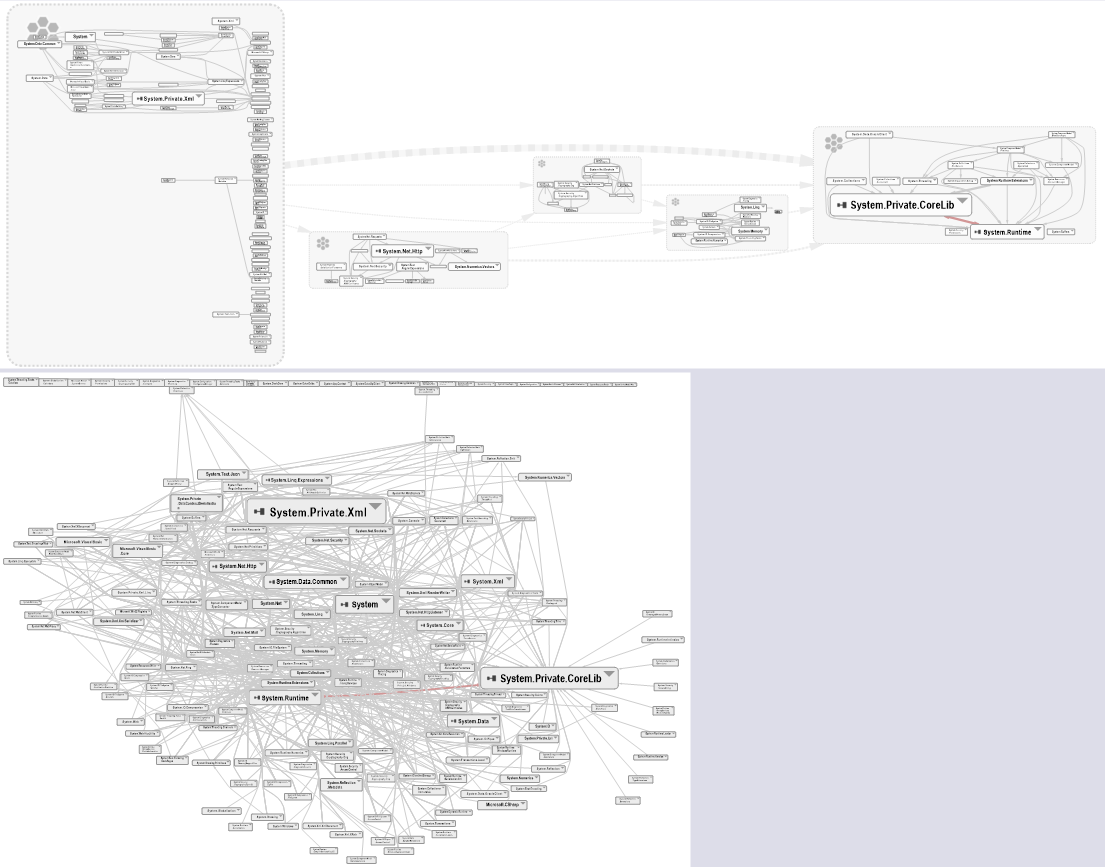
When there are too many projects clusters are absolutely needed to obtain a comprehensive project dependency diagram. Here are 176 .NET Core assemblies with and without clusters. Clustering is optimized to obtain comprehensive graph even on largest Visual Studio solution with thousands of projects.
Project Element Size
By default element size is proportional to number of lines of code. The menu Layout > Constant Area for example can be used to change this layout:
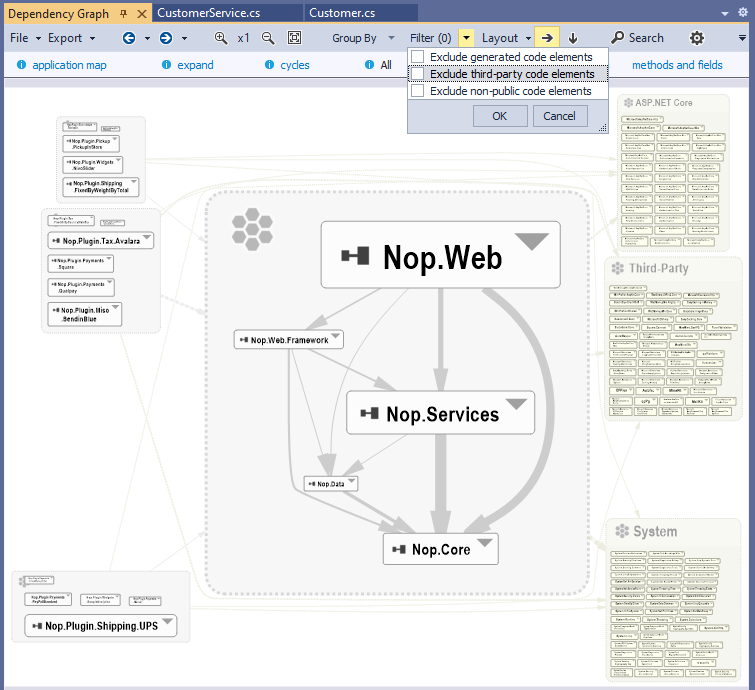
Show Project's References
Assemblies referenced by your projects can be shown through the menu Filters > -Uncheck- Exclude third-party code elements. Typically dozens of assemblies are referenced and when showing Project's References often clustering is required to obtain a comprehensive graph:
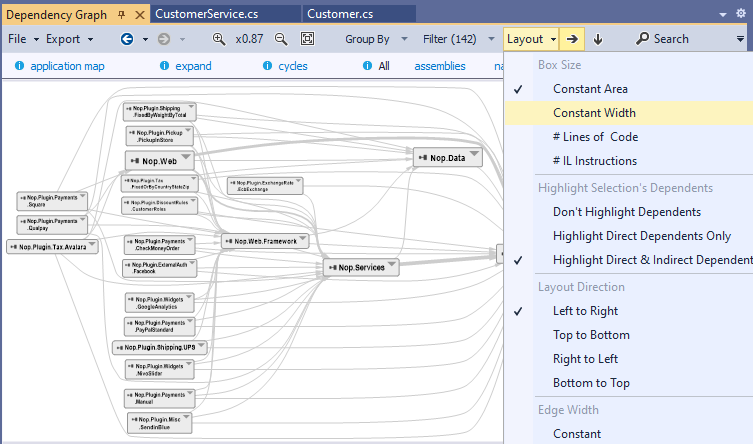
Search Projects
With the button Search it is easy to search for projects by name. In the animation below we search for projects whose name contain "Web" and then we click the button keep to generate a project dependency diagram with only projects matched:
Project's Dependents
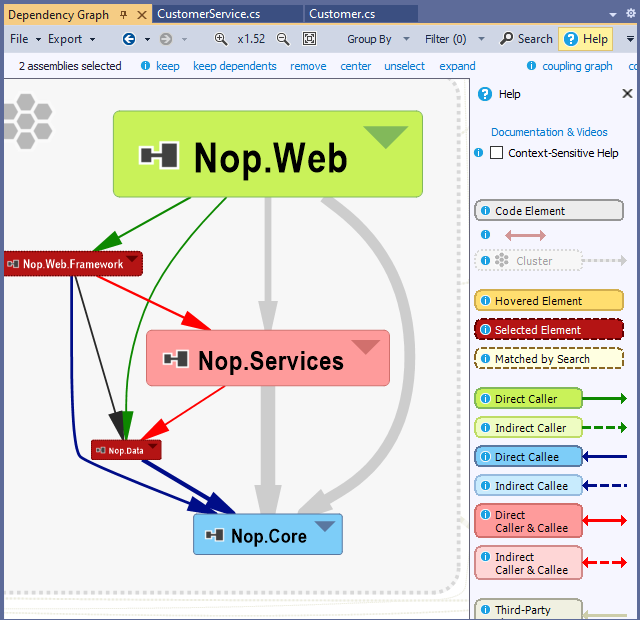
When hovering a project A, projects that use A are highlighted in green and projects used by project A are highlighted in blue. Light green and light blue are used to highlight indirect dependents. This facility is useful to browse large Dependency Diagram with many projects.
When selecting a project, the button keep dependents can be used to keep only projects highlighted.
Tips: the Help bar (shown by default) is useful to get acquainted with the color scheme:
Explore Classes in a Project
There are several ways to explore the classes within a project, here are two ways:
The project box can be expanded. Also when a project is selected the navigation bar shown a button expand that can be used to expand the selected element(s).
- First click on this button expand expands namespaces in the project(s) selected
- Second click expands till classes in the project(s) selected
- Third click expands till methods and fields level
From the Visual Studio Solution Explorer a project can be right-clicked and then the menu Show on Dependency Graph can be clicked.
Explore Classes Involved in the Coupling between 2 Projects
Any edge can be double-clicked to obtain a Coupling Graph: For example a graph of classes involved in the coupling between 2 projects.
Actually double-clicking an edge also generates a code query to obtain the classes involved in the coupling:

Export a project dependency diagram
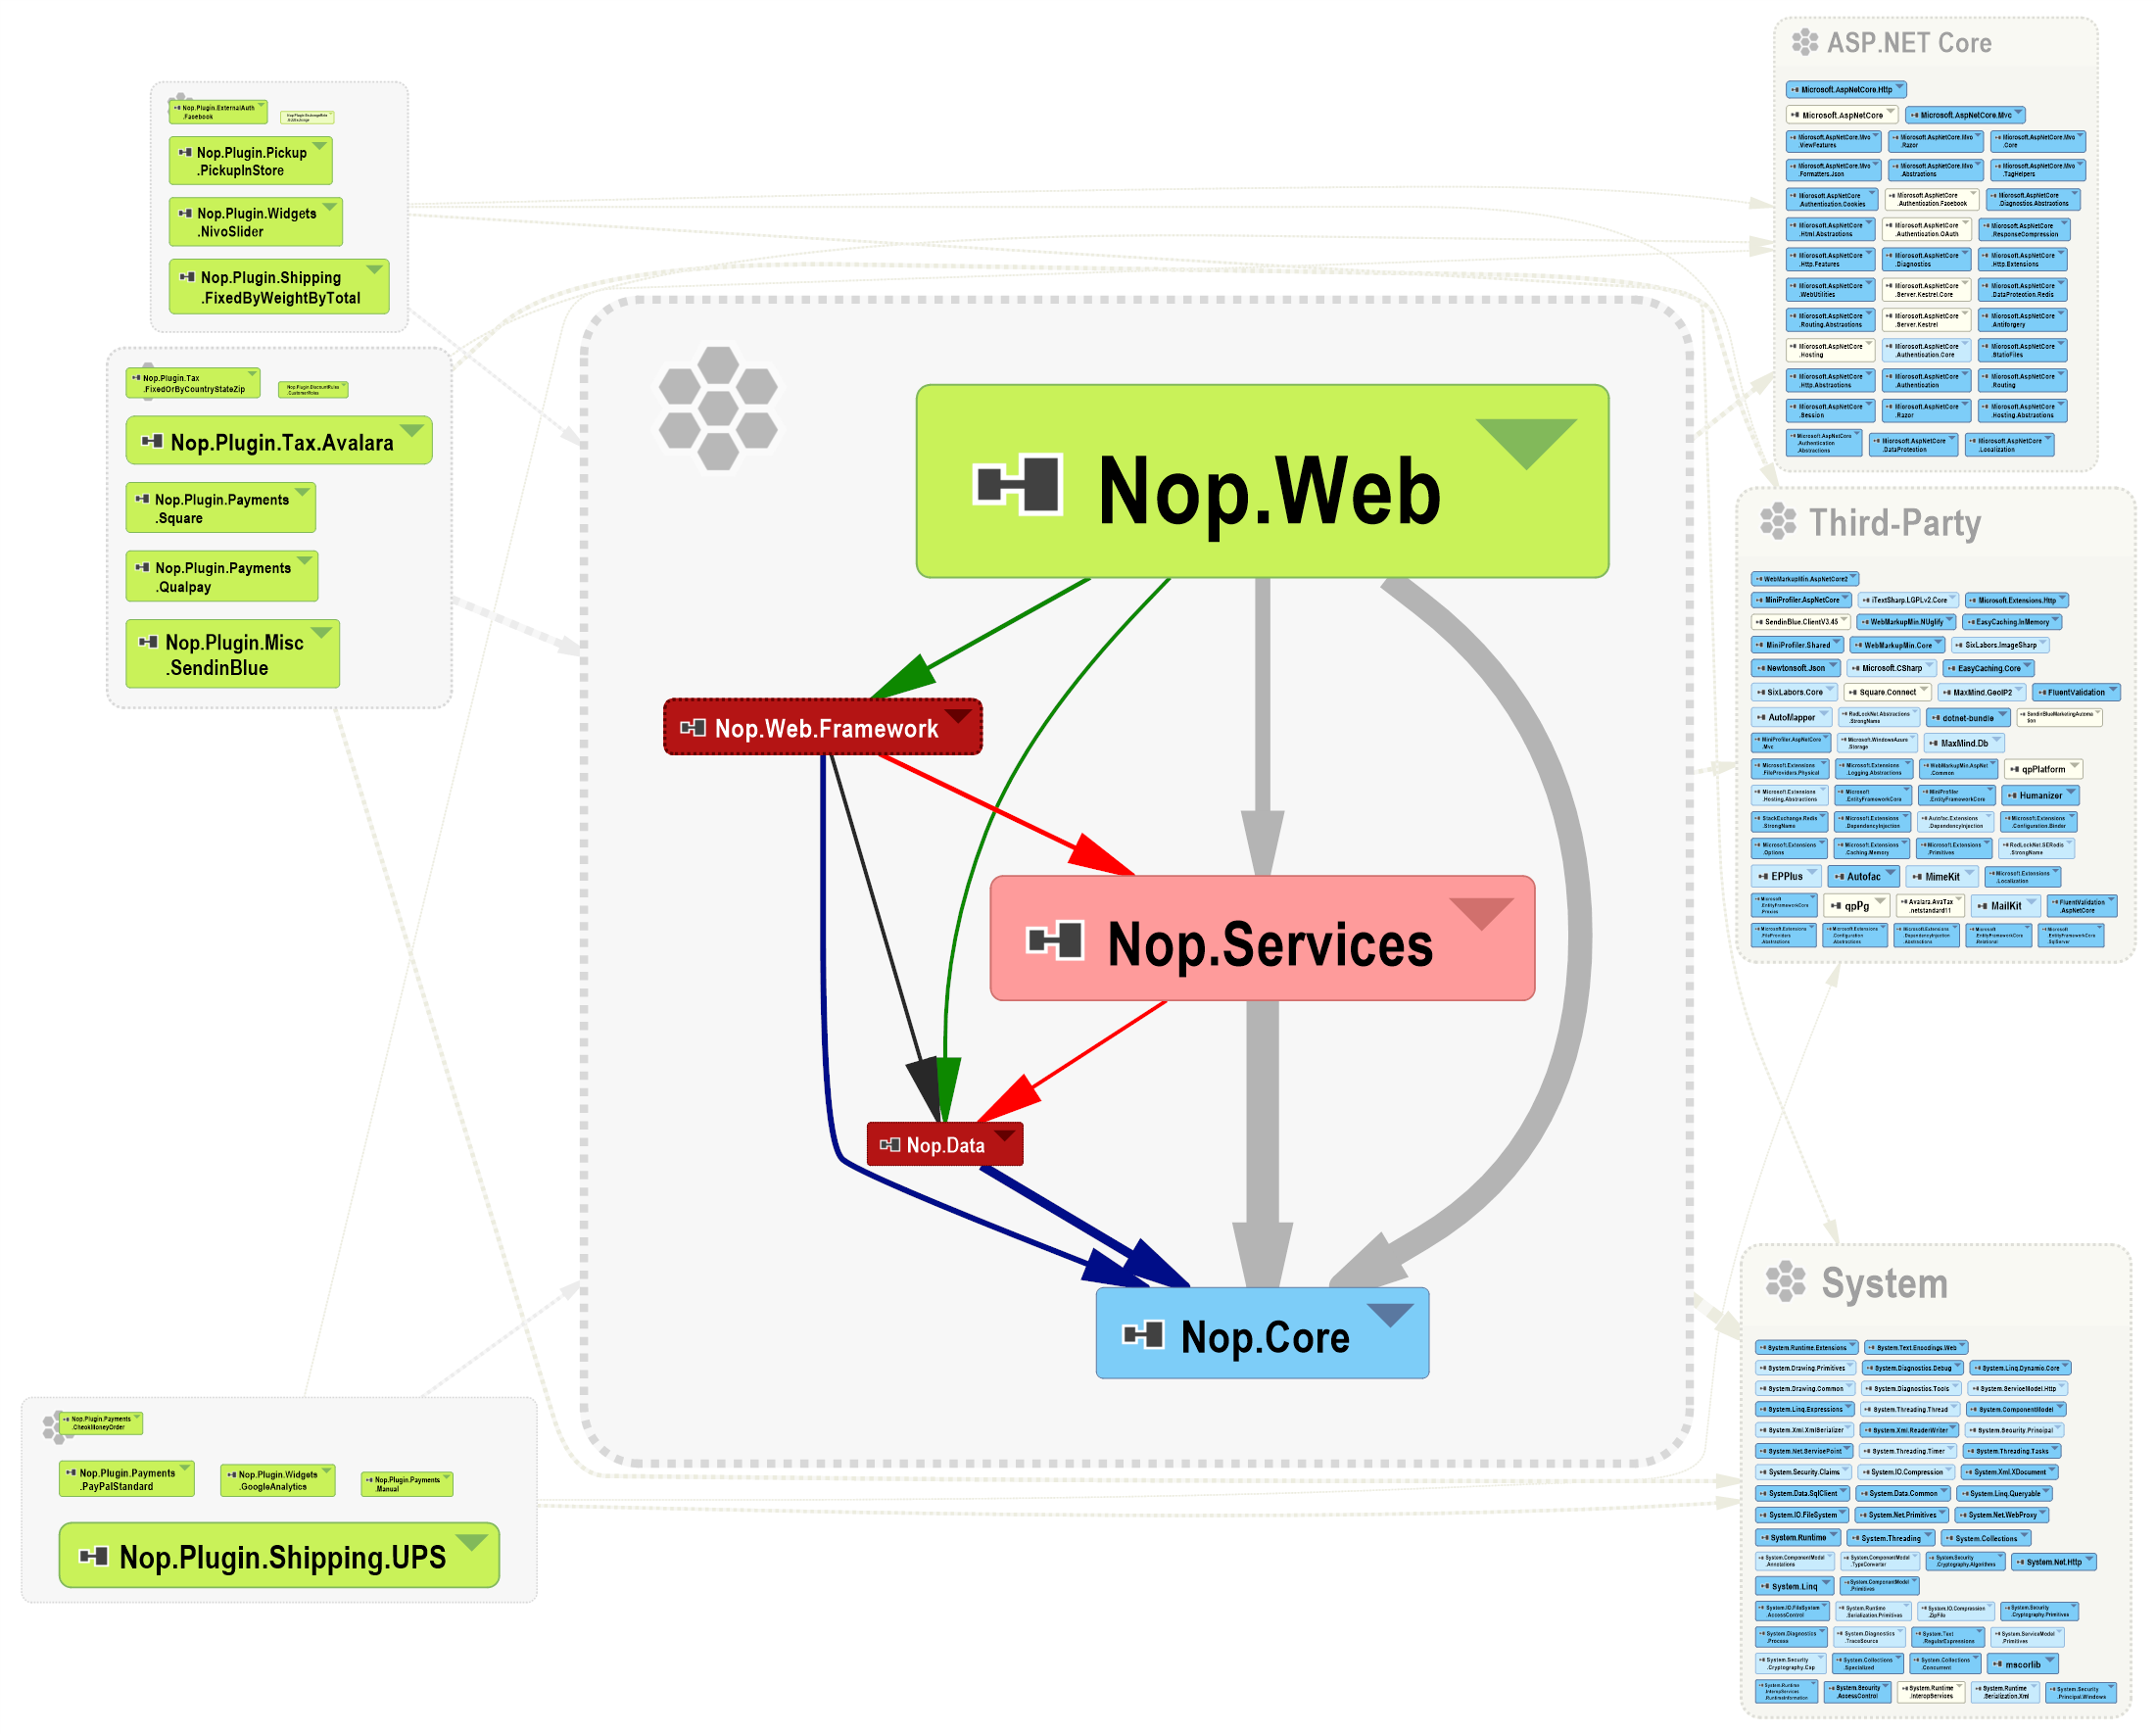
A Project Dependency Diagram can be exported to PNG or SVG vector format. When clicking an export button, the actual zoom factor is used to define the size of the exported view. Hence the zoom factor can be used to obtain large views if this is what you need.
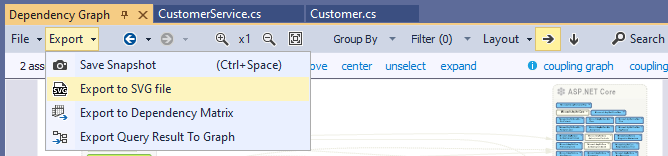
Here is such large 2201x1770 PNG image, and here is the corresponding SVG vector view: