
Trend Monitoring
NDepend Trend Charts (3 minutes)
Introduction
NDepend plots trend charts over time. Trend charts are made of trend metrics values logged over time at analysis time. More than 70 default trend metrics are available and it is easy to create your own trend metrics.

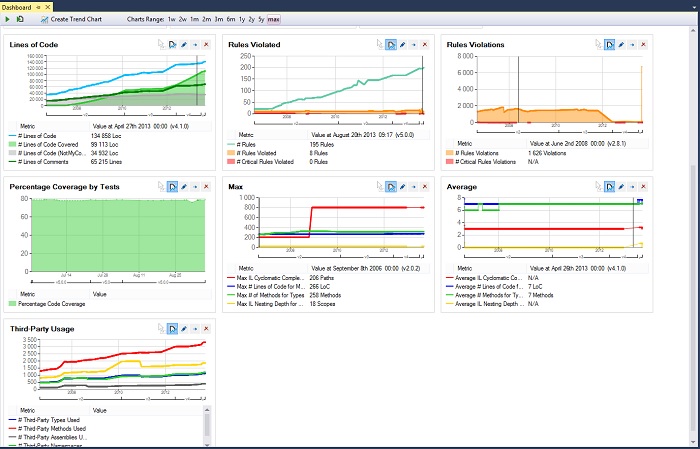
Trend charts are displayed in the NDepend dashboard, in the NDepend report and in the Azure DevOps hub. Some trend charts are available per default to show:
- Lines of Code
- Number of Code Rules Violated and number of Code Rules Violations
- Code Coverage per Tests
- Max and Average values for various Code Quality Metrics
- Third-Party Usage
Trend charts can be customized and it is easy to create your own trend charts to show default trend metrics and/or custom trend metrics.
For all trending related operations, a trend menu is available.

Trend Metrics
To list the default trend metrics, look at the Queries and Rules Explorer panel and select the group named Trend Metrics.
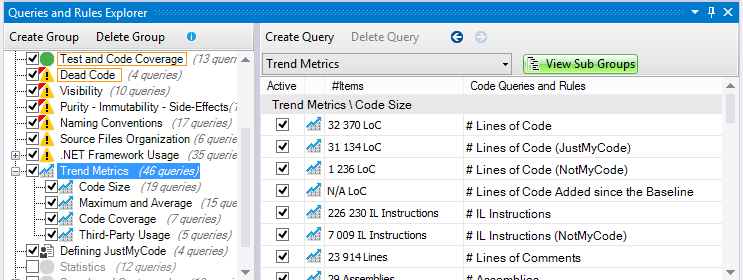
x If trend metrics are listed in the code queries panel, it is because a trend metric is a CQLinq code query. It is a particular code query:
- Typically a trend metric is a code query that returns a scalar. Hence trend metrics query often use LINQ aggregate operators that returns a scalar. This includes operators like Count() Sum() Average() Min() Max() ...
- Since NDepend v2017.1.0 a trend metric can also return rows. This facility is useful to make the Trend Metric result more informative when it makes sense.
- The header of a code query is a comment line formatted this way // <TrendMetric Name="Metric Name" Unit="Metric Unit Name" />
For example here is the # Lines of Code trend metric code query:

Since a trend metric is a code query, it is easy to create your own trend metrics or modify existing ones. For example here is a code query that counts the number of types implementing the interface System.IDisposable:

Finally notice that when defining a Quality Gate thresholds, the keyword value must be replaced with the keyword count if the LINQ query is returning some rows instead of returning a scalar.
Trend metrics are logged at analysis time as explained in the section Logging Trend Metrics.
Trend Charts
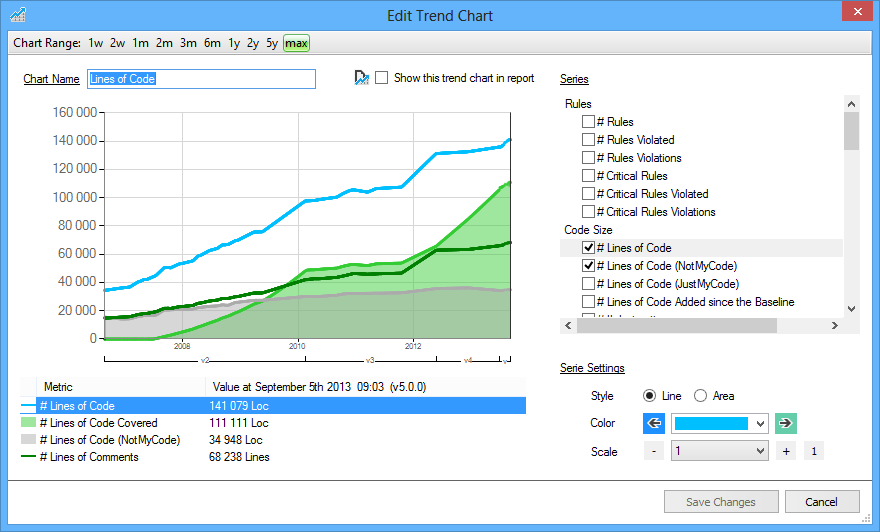
The Create or Edit trend charts dialog lets us define all trend charts properties. The list of trend metrics series is available and checking a series lets us visualize it on the trend chart. A series appearance can be customized, this includes:
- The color of the series
- If the series is displayed as a line or as an area
- Defining the series scale. The scale setting is useful to adjust several series scales to compare them on the same trend chart.
Reporting Trend Charts
In the picture above we can see a tick box labeled: Show this trend chart in report. Trend charts can indeed be displayed in a report.
Here you can see an example of Trend Charts in a report, made on the NDepend code base itself.For that the tick box NDepend Project Properties panel > Report tab > Use standard report ticked > Trend Charts must be ticked.

Logging Trend Metrics
Trend metrics values are logged at analysis time. By running analysis every days, a list of trend metric dated values is built.
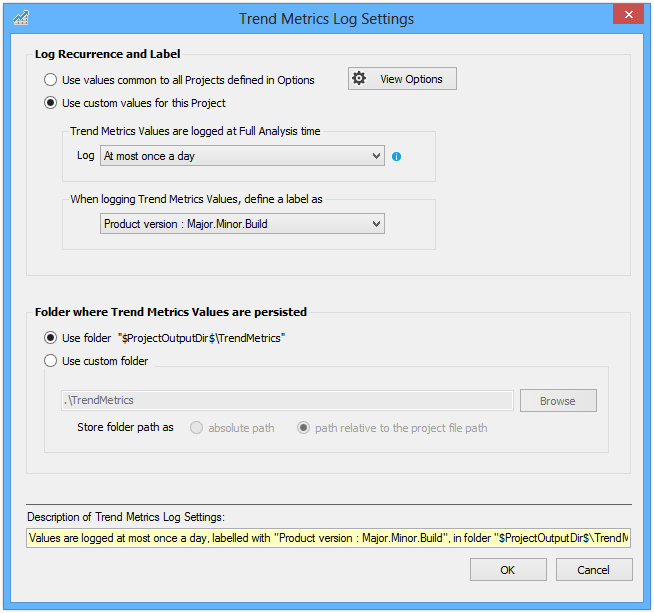
Settings related to log of trend metrics values are available, both in the NDepend Options > Trend section, and in the NDepend Project Properties > Analysis > Trend Metrics Log section. If settings in Project Properties are set, they override the global settings defined in the Options.
Trend metrics log settings includes:
- The frequency of logs (like for example at most once a day or at most once a week)
The definition of a label for each log, that represents the product version of the code base analysed. In the trend chart screenshot above you can see that this version label is displayed on the trend charts on the timeline X axis.
Note: The product version is inferred from the application assemblies version obtained from System.Reflection.AssemblyVersionAttribute. If several application assemblies have different versions, the version tagging the most application assemblies is used. In a situation where for example, 10 application assemblies have version1 and 10 others application assemblies have version2, the higher version is chosen.
- The folder where files that contain trend metrics values are persisted. To avoid excessively large files, a file is created for each year.
Note that no matter what trend metrics log settings are used, the NDepend.Console.exe command line parameter /LogTrendMetrics will force logging of trend metrics during the analysis.
NDepend.API and Trending
The namespace NDepend.Trend contains types and methods to load, save and remove trend metric values in the trend store. These operations are processed through an object that implements the interface NDepend.Trend.IStore.
The interface NDepend.Project.IProjectTrend lets us read an modify project trend settings.
The extension method LogTrendMetrics() forces the log of trend metrics on a IAnalysisResult object.
In the OSS Power Tools, you'll find a tool named List stored Trend Values that demonstrates how to use the NDepend.API to read trend metrics values from a trend store.