
Monitor Code Trend
NDepend plots trend charts over time. Trend charts are made of trend metrics values logged over time at analysis time. More than 70 default trend metrics are available and it is easy to create your own trend metrics.

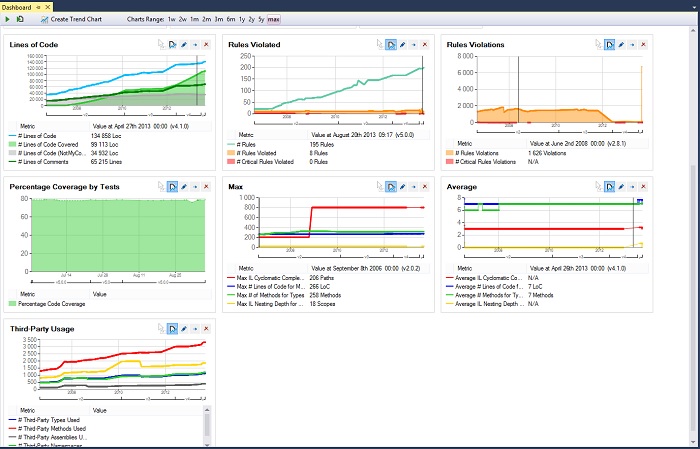
Trend charts are displayed in the NDepend dashboard, in the NDepend report and in the Azure DevOps hub. Some trend charts follow the trend of:
- Lines of code
- Technical-debt expressed in human-time to fix issues
- Number of issues
- Number of code rules violated
- Code coverage ratio
- Max and average values for various code quality metrics like method's Cyclomatic Complexity
- Third-party libraries usage
Trend charts can be customized (color, metrics, scale...) and it is easy to create your own trend charts to show default trend metrics and/or custom trend metrics.
Since a trend metric is a code query, it is easy to create your own trend metrics or modify existing ones. For example here is a code query that counts the number of types implementing the interface System.IDisposable:

Here is a 3 minutes video that explains Code Trend Monitoring with NDepend: